
Figure 4.
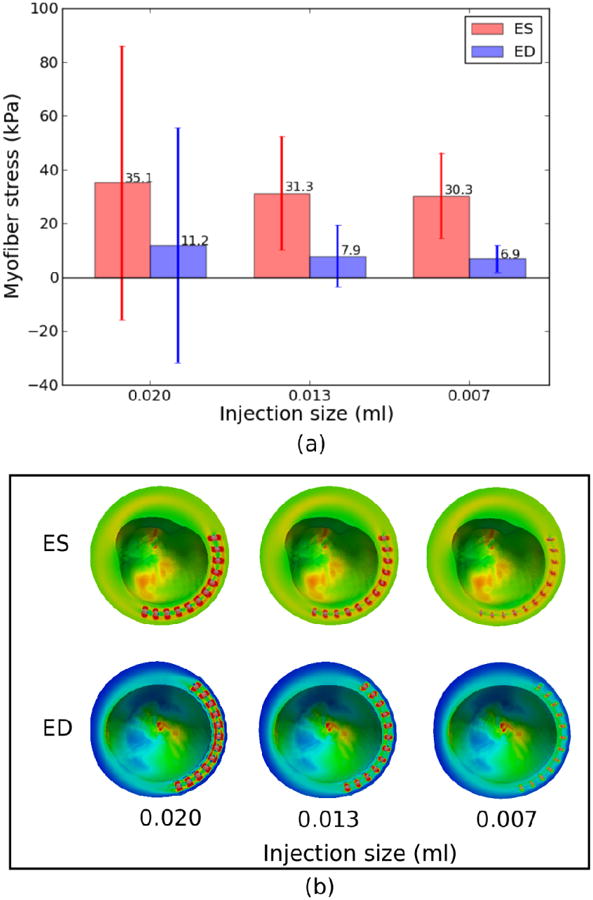
Effects of injection size (with constant void size) on (a) global myofiber stress and (b) regional myofiber stress near the injection sites. Mean values of myofiber stress are given on top of each bar in (a). Refer to Fig. 2 and 3's legend for ED and ES regional myofiber stress in (b), respectively.