
Figure 2.
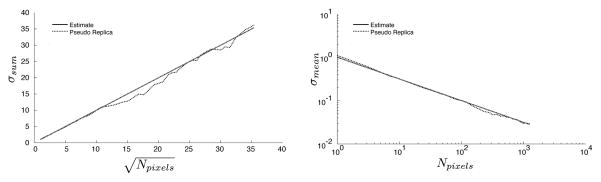
An illustration of the relationship between the standard deviation of a magnitude ROI and the number of pixels for a reconstruction where all pixels are independent and no parallel imaging was employed. The left plot shows the sum of the pixel magnitudes as a function of the square root of the number of pixels in a linear coordinate system and the right plot shows the mean of the pixel magnitudes as a function of the number of pixels in a log-log coordinate system.