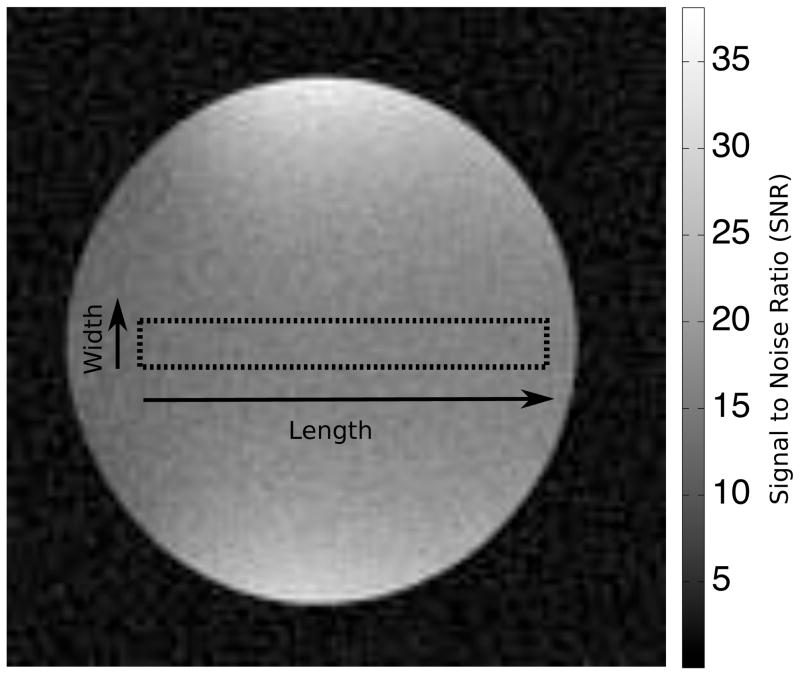
Figure 3.
Illustration of the spherical phantom used in the phantom experiments. The reconstruction depicted is for fully sampled data and the dotted line outlines the largest ROI analyzed. The ROI is oriented along the phase encoding direction. The grey scale is in units of SNR and the average SNR in the depicted ROI is ~15.

