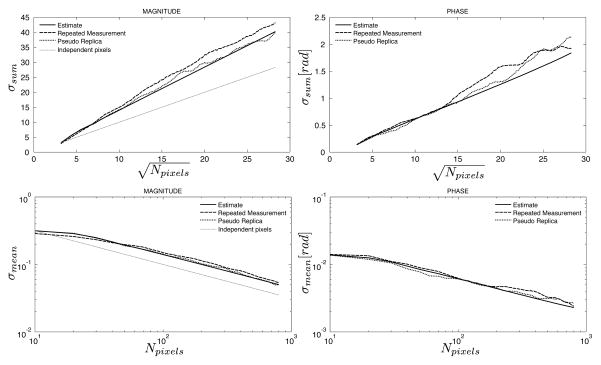
Figure 5.
Measured and predicted standard deviations of the sum (top row) and mean (bottom row) of an ROI as a function of the number of pixels in the ROI as it grows along the phase encoding direction in an image with reduced effective resolution in the phase encoding direction. The solid line is the predicted standard deviation from the proposed method, the dashed line is the calculated standard deviation from 100 repeated experiments, and the dotted line is the calculated standard deviation from 100 pseudo replica reconstructions. The gray dotted line on the magnitude plots indicated the predicted standard deviation when assuming that all pixels are independent. Compared to Fig. 4, the actual standard deviations and the gray line are in agreement for an ROI with length 1 but deviates as the ROI increases in length.

