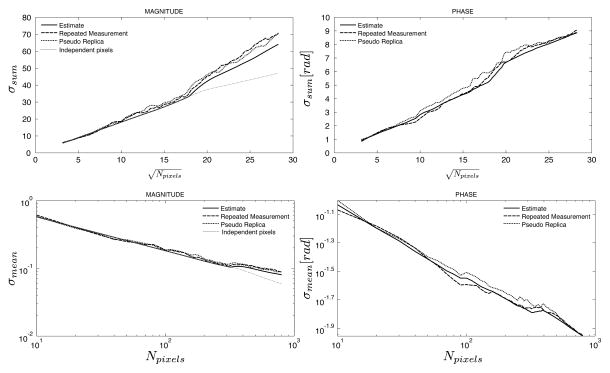
Figure 7.
Comparison of predicted and measured standard deviations of the sum (top row) and mean (bottom row) of an ROI as it grows along the phase encoding direction in an image with parallel imaging factor 4. Plot is similar to Fig. 6, but the sampling pattern used here sampled lines 3, 7, 11, …, i.e. the sampling pattern was still undersampled by a factor of 4, but the sampled lines were shifted by 2 lines in k-space.

