
Figure 1.
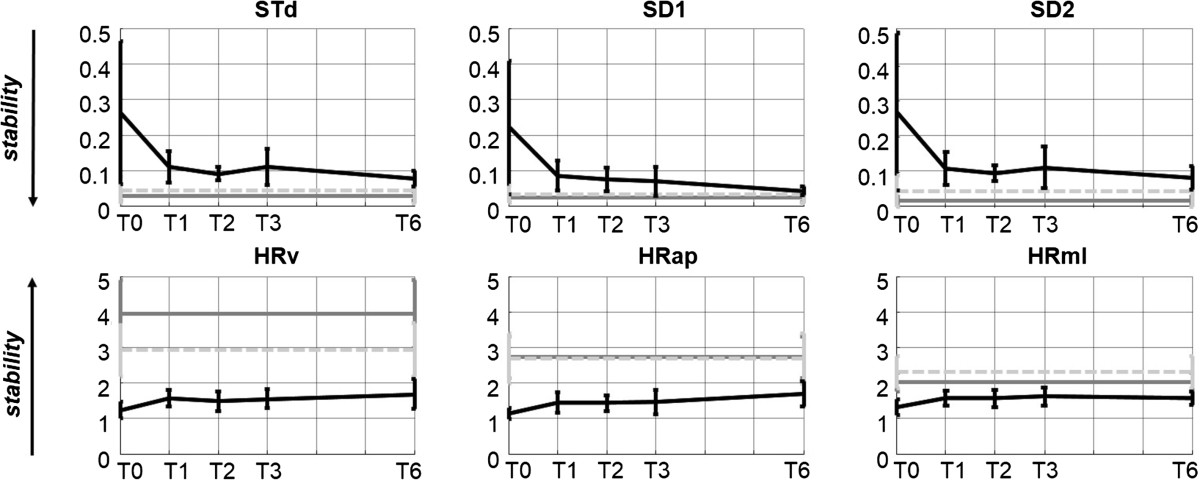
Variability index results. Mean and standard deviation of variability indices of toddlers (black solid lines) and adults (dark grey solid lines) and elderly adults (light grey dotted lines). (STv: stride-time variability. SD1 and SD2: short term and long term variability of stride time. HR: Harmonic ratio. V vertical, AP antero-posterior and ML medio-lateral axis).