
Figure 6.
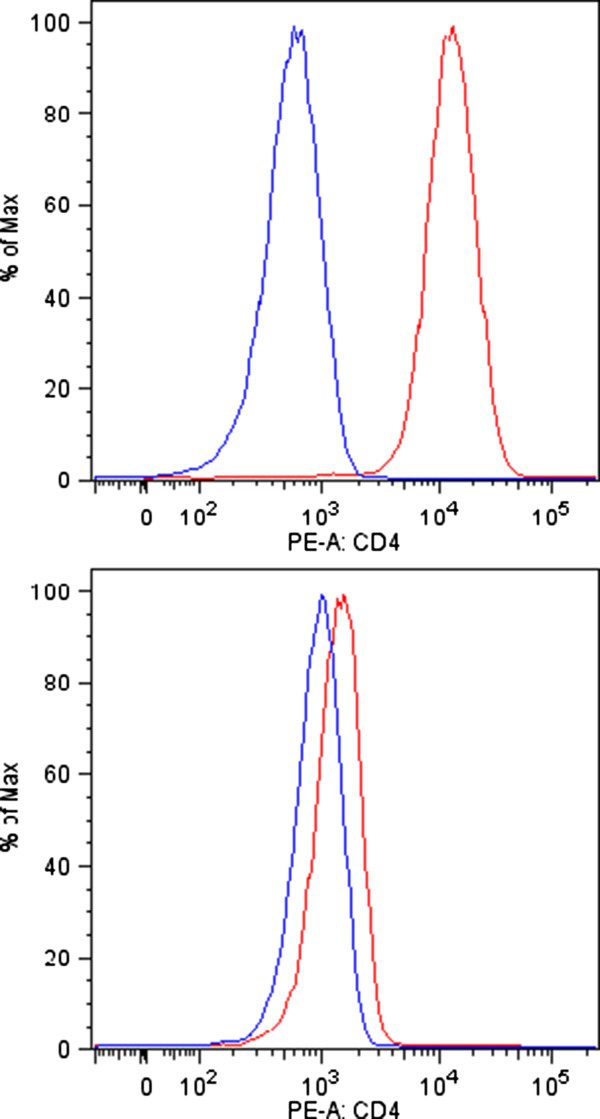
CD4 surface expression in SIV-infected C8166 T cell line determined by FACS analysis. CD4 surface expression on uninfected (upper panel) and chronically infected (lower panel) C-8166 cells as determined by flow cytometry. Blue lines depict unstained control samples, red lines staining with an antibody directed against CD4. Chronically infected cells display a slightly higher auto-fluorescence and only a little CD4 expression compared with uninfected cells.