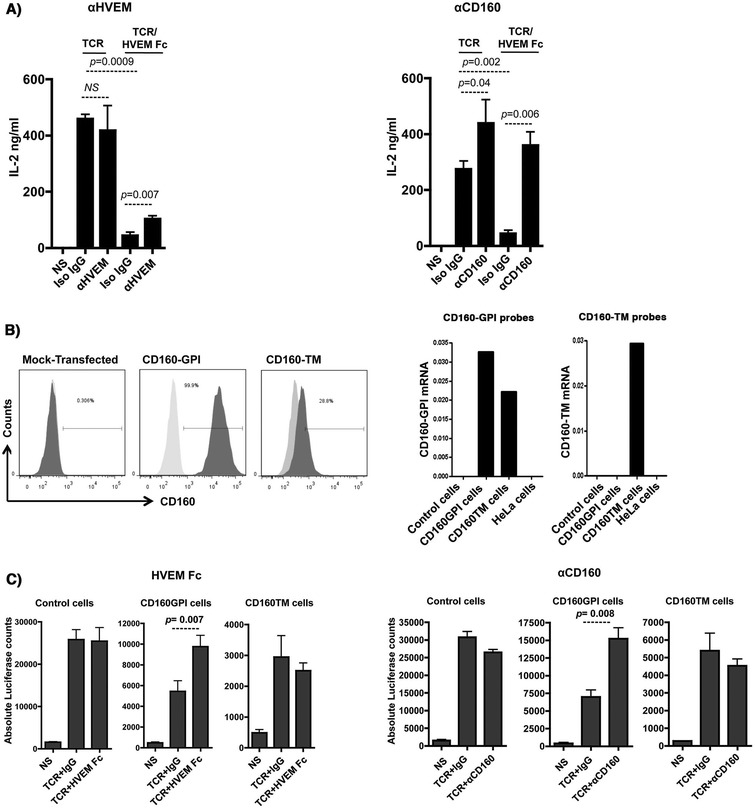
Figure 3.

Triggering of CD160-GPI is consistent with a positive co-stimulation role. A) Triggering of primary CD4+ T-cells with either plate-bound anti-CD3 (1 μg/ml) and anti-CD28 (0.5 μg/ml) or anti-CD3, anti-CD28 and HVEM-Fc (0.2 μg/ml) in the presence or absence of either anti-HVEM (left panel) or anti-CD160 clone CL1-R2 (right panel). IL-2 was measured in the supernatant by ELISA at 24 h post stimulation. Iso-IgG represents the matched isotype control antibody. P values were determined by two-tailed paired t test (data from three independent healthy donors). B) Left panels: Surface expression of CD160-GPI and CD160-TM on Jurkat-NFAT-Luc cells stably-transfected with CD160 plasmids. Mock-transfected cells (light grey histograms in middle and right panels) were used to set the positive and negative gates for FACS. CD160-TM is weakly detected with CD160-GPI antibodies (BY55 clone). Right panels: Quantitative RT-PCR for CD160-GPI and CD160-TM isoforms in Jurkat cells over-expressing either CD160-GPI or CD160-TM, values are relative to the house-keeping GAPDH gene transcripts (One representative experiment, n = 2). Non-transfected Jurkat (control cells) and HeLa cells were used as additional negative controls for CD160 expression. The left graph represents results with a set of Taqman probes that were not isoform selective and hybrdize both CD160-GPI and CD160-TM to demonstrate similar RNA expression levels, whereas the right graph used a set of probes that were CD160-TM specific to confirm the exclusive expression of the different CD160 isoforms in the two cell lines. C) Simultaneous triggering of TCR and CD160 using magnetic Dynal beads coated with anti-CD3, anti-CD28 and either HVEM-Fc (left panels), CD160 monoclonal antibodies (right panels) or their matched IgGs. Cell activation was monitored by measuring the absolute luciferase counts. Control cells are original Jurkat-NFAT-Luc cells non-transfected with either of the CD160 isoforms. NS: non-stimulated. P values were calculated by non-parametric two-tail t test (Mann–Whitney).
