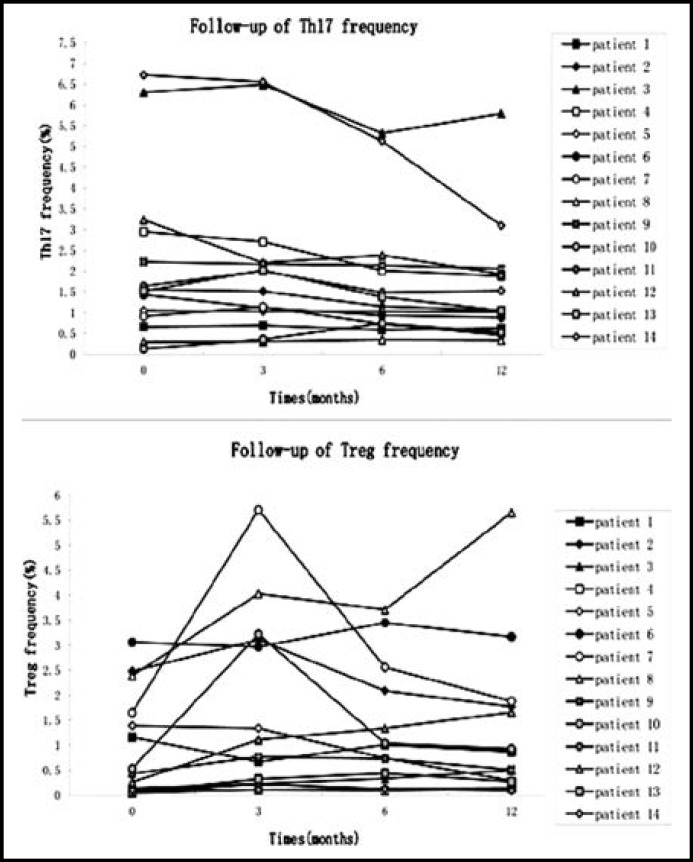
Fig.2.
Follow-up of Th17 and Treg frequencies. Th17 frequency showed a continuous decline from M3 to M12. The changes of Treg frequency were irregular. The Treg frequency was significantly elevated in M3, but showed no statistical significance in M6 and M12.[Th17 cells: M0 vs M3, p=0.925; M0 vs M6, p=0.011; M0 vs M12, p=0.008; M3 vs M6, p=0.026; M3 vs M12, p=0.004; M6 vs M12, p=0.044. Treg cells: M0 vs M3, p=0.020; M0 vs M6, p=0.069; M0 vs M12, p=0.198; M3 vs M6, p=0.379; M3 vs M12, p=0.490; M6 vs M12, p=0.258.]

