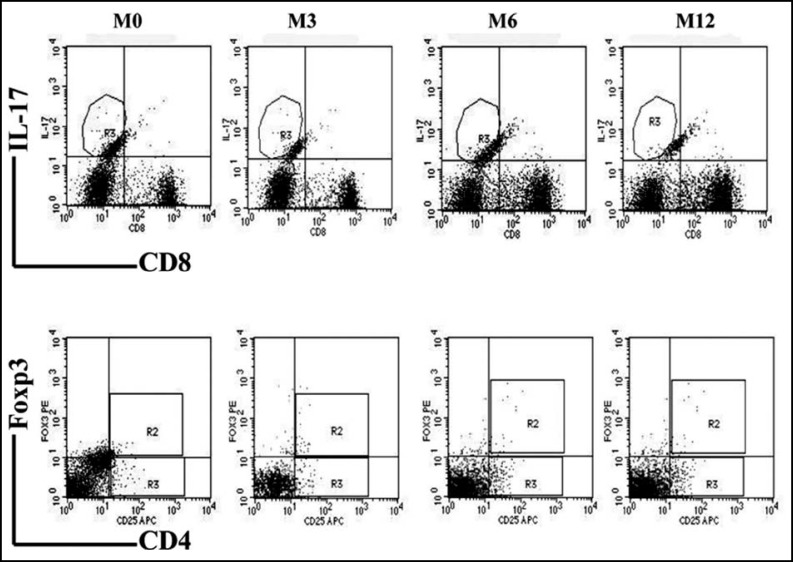
Fig.3.
Decreasing frequencies of Th17 cells in patients with CLL after treatment. The changes of Treg frequency were irregular. Plots in intern box represented flow cytometric analysis at M0, M3, M6 and M12 of Th17 (CD8-IL17+) cells(Top panels) and Treg(CD4+CD25+Foxp3+) cells(Bottom panels) from a single subject (patient 12) who had the typical changes in the follow-up

