Figure 2.

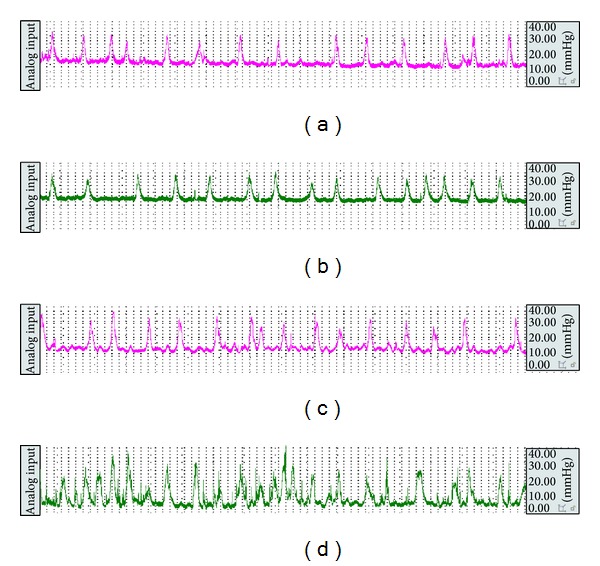
The representative curve of colonic movement in the control group (a) and the model group (b) before enema and in the control group (c) and the model group (d) after stress.

The representative curve of colonic movement in the control group (a) and the model group (b) before enema and in the control group (c) and the model group (d) after stress.