
Figure 8.
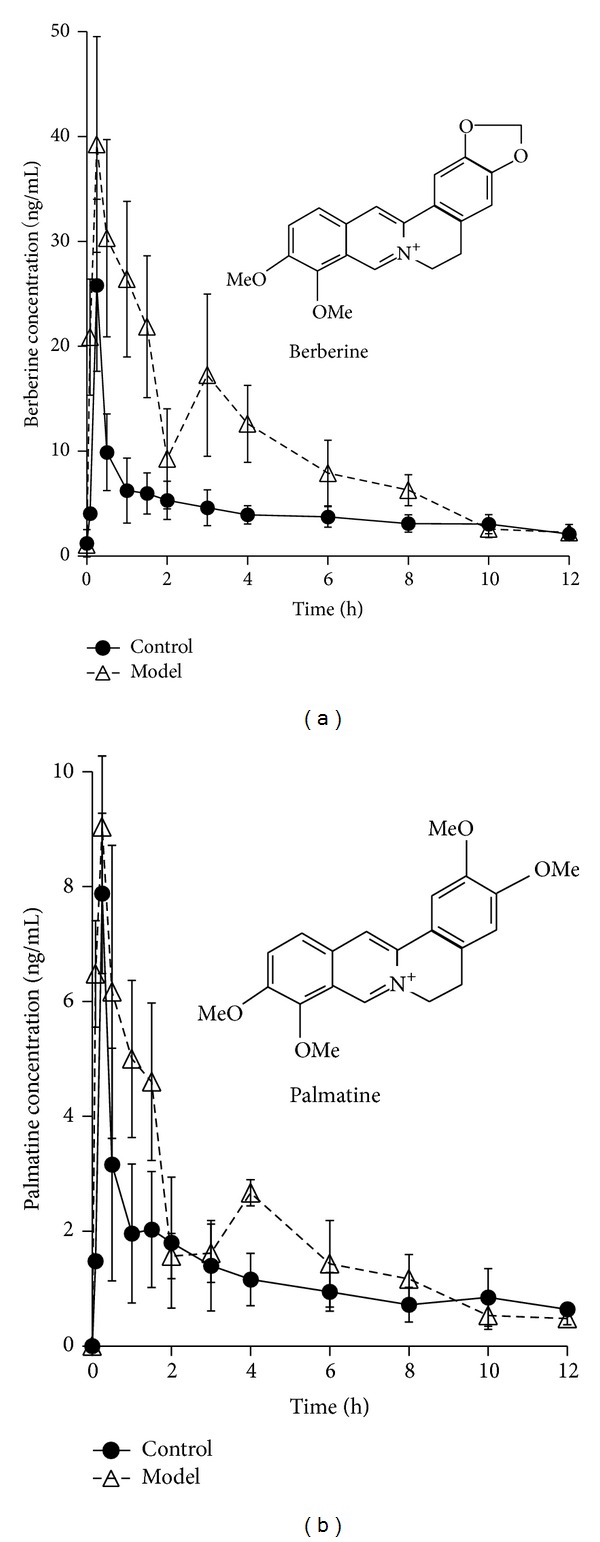
The mean plasma concentration (ng/mL) of berberine and palmatine versus time (h) profiles after oral administration of Rhizoma Coptidis extract in the control and PI-IBS model rats. Values were expressed as mean ± SD (n = 5).
Official websites use .gov
A
.gov website belongs to an official
government organization in the United States.
Secure .gov websites use HTTPS
A lock (
) or https:// means you've safely
connected to the .gov website. Share sensitive
information only on official, secure websites.
The mean plasma concentration (ng/mL) of berberine and palmatine versus time (h) profiles after oral administration of Rhizoma Coptidis extract in the control and PI-IBS model rats. Values were expressed as mean ± SD (n = 5).