Figure 2.

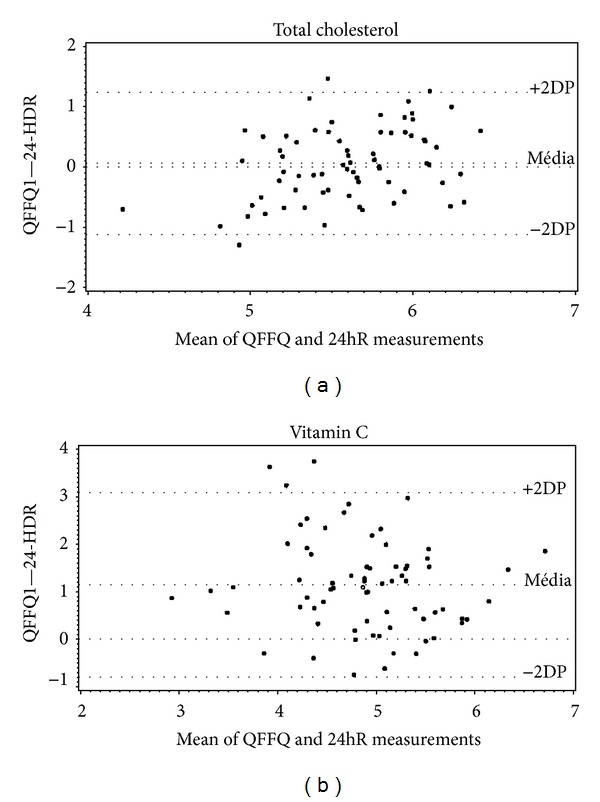
Bland-Altman plots for mean values of total cholesterol and vitamin C intake. These values were obtained from the application of QFFQ and 24hR on type 1 diabetes adolescent patients. Goiânia, Brazil, 2009.

Bland-Altman plots for mean values of total cholesterol and vitamin C intake. These values were obtained from the application of QFFQ and 24hR on type 1 diabetes adolescent patients. Goiânia, Brazil, 2009.