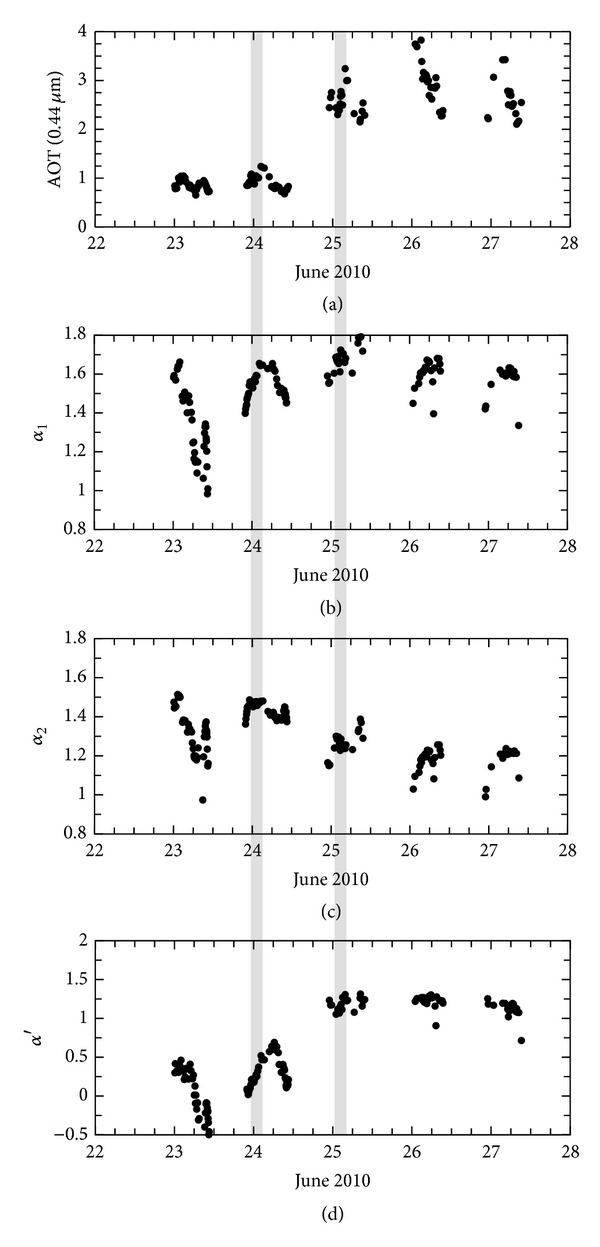
Figure 2.

AERONET data (Level 2) at the AERONET Beijing site in June 2010. Figures (a), (b), (c), and (d) represent AOT (0.44 μm), Ångström exponent α 1(λ 3, λ 2), α 2(λ 2, λ 1), derivatives of the Ångström exponent α′, where λ 1, λ 2, and λ 3 take values of 0.44, 0.675, and 0.87 μm, respectively.
