
Figure 8.
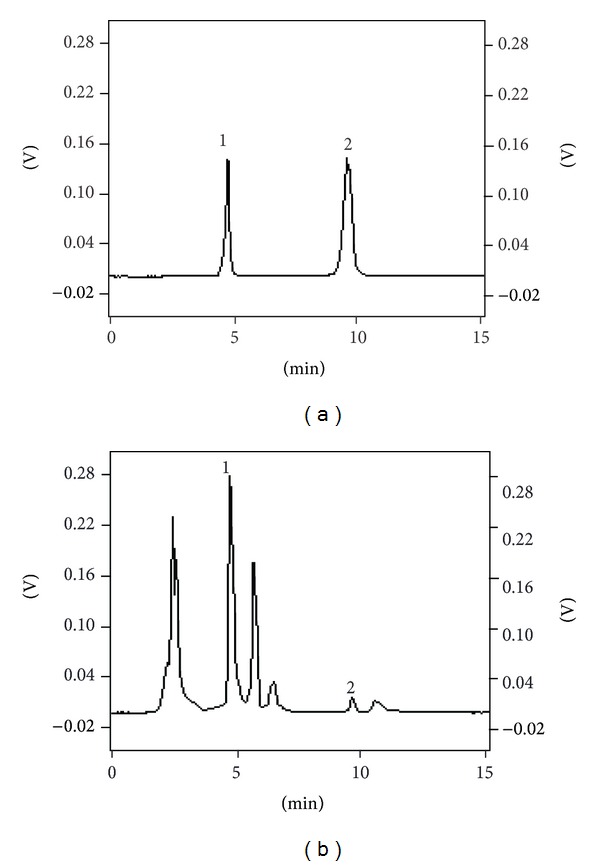
Chromatograms of RU and QU standard mixture (a), sample (b), Peak 1 for RU, and Peak 2 for QU under optimal conditions.
Official websites use .gov
A
.gov website belongs to an official
government organization in the United States.
Secure .gov websites use HTTPS
A lock (
) or https:// means you've safely
connected to the .gov website. Share sensitive
information only on official, secure websites.
Chromatograms of RU and QU standard mixture (a), sample (b), Peak 1 for RU, and Peak 2 for QU under optimal conditions.