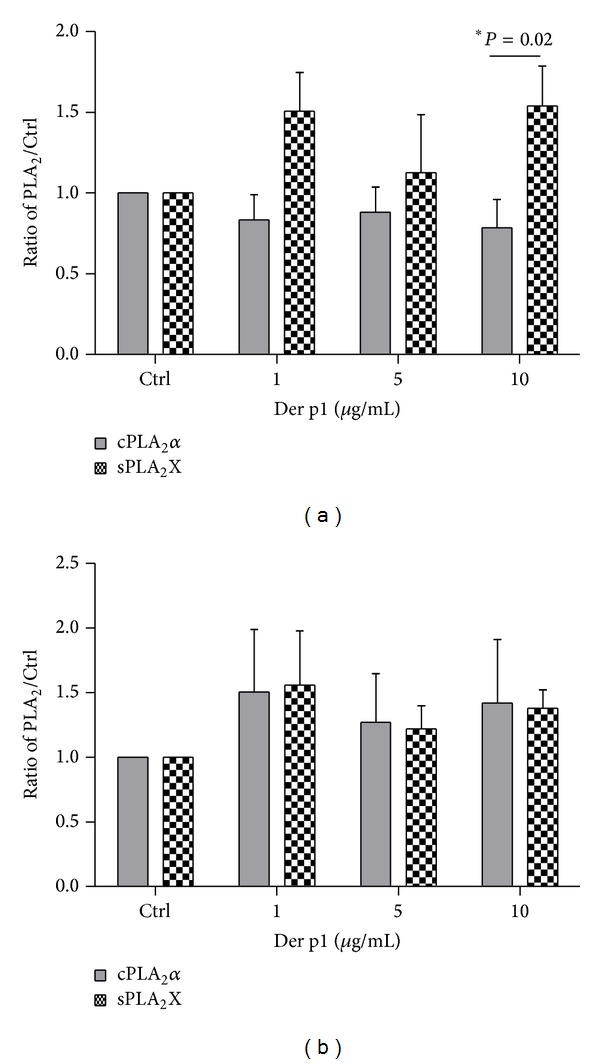
Figure 2.

sPLA2X secretion and relative expression of cPLAα in PBMC of asthmatics (a) and healthy subjects (b) in response to rDer p1. PBMC (2 × 10⁶) were stimulated with indicated doses of rDer p1 for 24 hours. Control represents cells treated with the vehicle. The bar graph shows the densitometry results for cPLA2 (immunoblotting results) and ELISA results for sPLA2X secretion. Data are presented as the fold change compared with the vehicle-treated cells. Data represent the mean ± SE from at least six independent experiments. ∗P < 0.05 shows comparison between relative protein expression of cPLA2 and secretion of sPLA2X.
