
Figure 5.
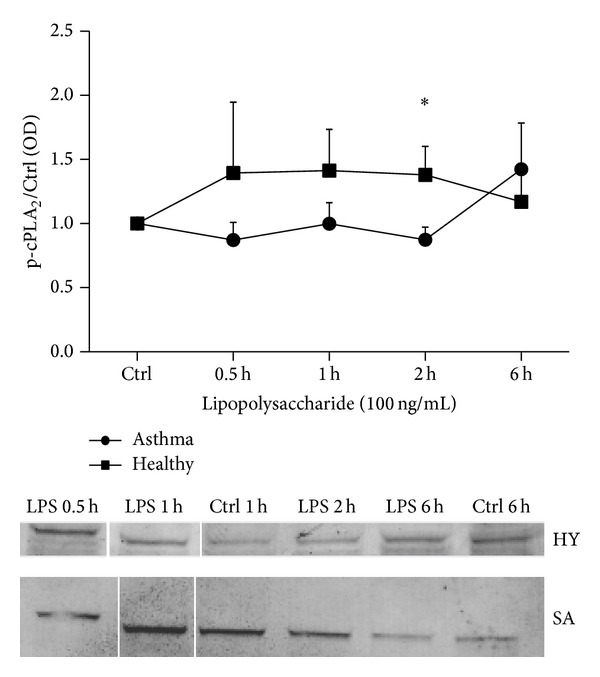
Phosphorylation of cPLA2 α protein in PBMC from healthy subjects and asthmatic patients in vitro stimulated with LPS. PBMC (2 × 10⁶) were stimulated with 100 ng/mL of LPS at indicated timepoints. Control represents cells treated with the vehicle. The immunoblot is representative of experiments in PBMC from at least six donors, each showing similar results. The line graph shows the densitometry results obtained from PBMC stimulated with LPS. Dataare presented as the fold change compared with the vehicle-treated cells. Data represent the mean ± SE from at least six independent experiments. ∗P < 0.05 shows comparison between studied groups.