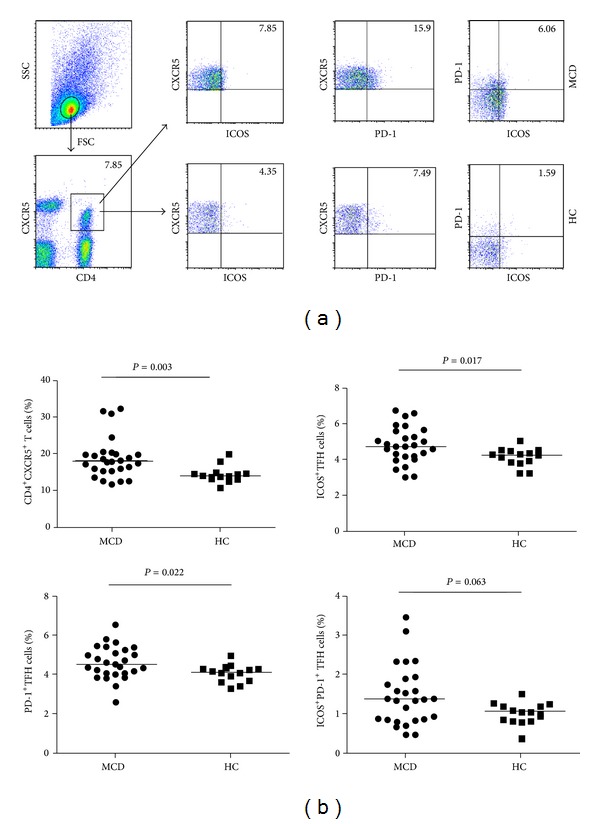
Figure 1.

Flow cytometry analysis of TFH cells. PBMCs from MCD patients' pre- and posthormone drugs treatment as well as HC were stained with anti-CD4, anti-CD3, anti-CXCR5, anti-ICOS, and anti-PD-1. The cells were gated initially on living lymphocytes and then on CD3+CD4+ T cells. Subsequently, the frequency of CD4+CXCR5+, CD4+CXCR5+ICOS+, CD4+CXCR5+PD-1+, and CD4+CXCR5+PD-1+ICOS+ TFH cells was analyzed by flow cytometry. (a) Flow cytometry analysis and (b) quantitative analysis. Data shown are representative dot plug or expressed as the mean % of different subsets of TFH cells in total CD3+CD4+ T-cells individual subjects from two separate experiments. The horizontal lines represent the median values.
