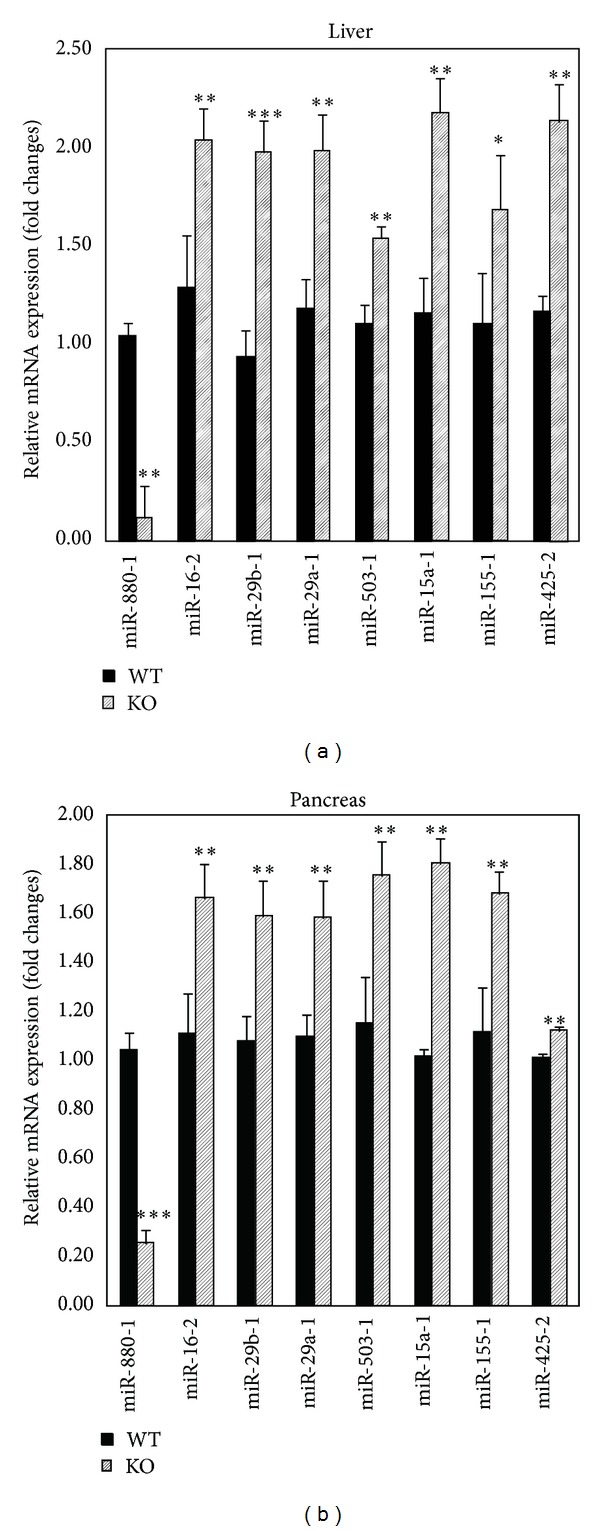
Figure 2.

Validation of PCR array data by RT-qPCR. RT-qPCR analysis was performed using differentially expressed miRNAs in liver (a) and pancreas (b) RNA samples previously profiled by PCR array. Triplicate assays were carried out for each RNA sample and the relative amount of each miRNA was normalized to U6 snRNA. Data are expressed as fold changes of miRNA in livers and pancreas of Cmah-null versus control (C57BL/6) mice (mean ± SE, n = 3) (*P < 0.05; **P < 0.01; ***P < 0.001).
