
Figure 3.
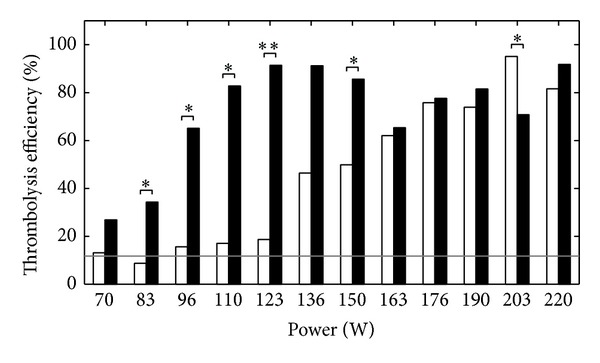
Thrombolysis efficiency as a function of the power (P ac), for a monofrequency excitation (white bars) and a bifrequency excitation (black bars). *P < 0.05 and **P < 0.001. The grey line corresponds to the baseline thrombolysis of the nonsonicated control group (12 ± 7% (mean ± standard deviation)).