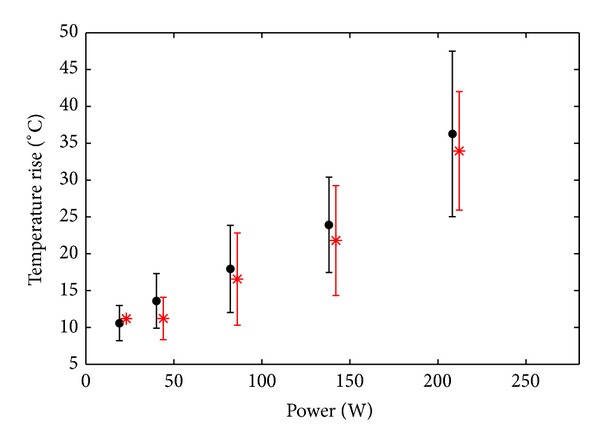
Figure 8.

Average temperature rise at the focus as a function of the applied power, for a monofrequency excitation (black discs) and a bifrequency excitation (red asterisks), after 300 s of pulsed sonication 10% duty cycle. Error bars show intersample standard deviation.
