Figure 3.

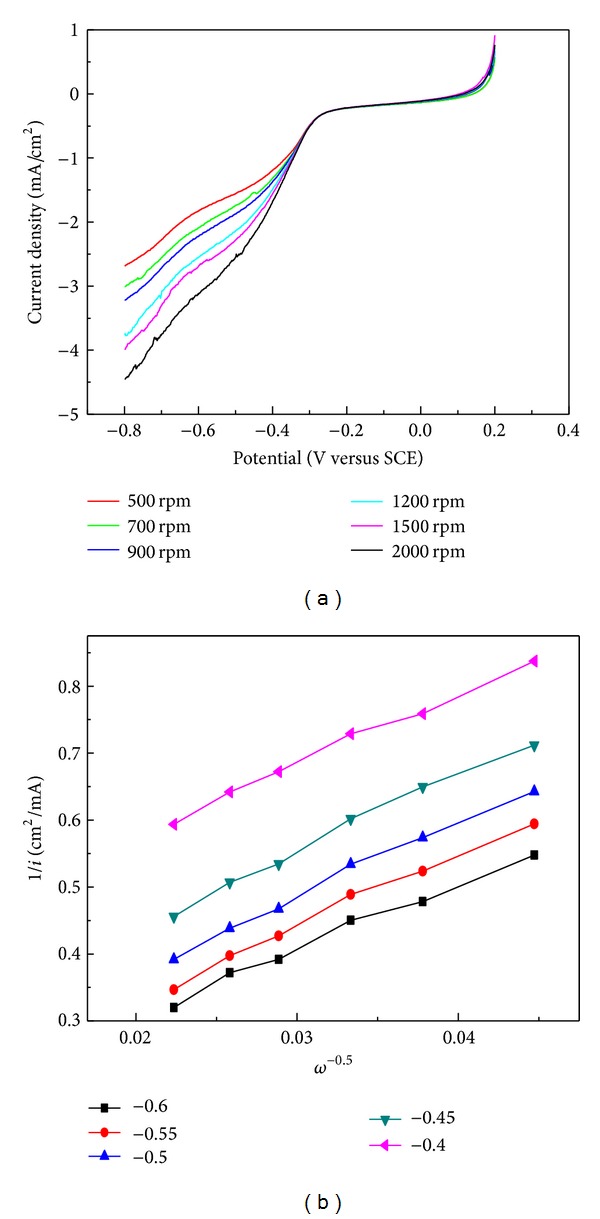
LSV plots at different rotation rates and corresponding Koutecky-Levich plots of sample Biochar-act900 at a scan rate of 100 mv/s.

LSV plots at different rotation rates and corresponding Koutecky-Levich plots of sample Biochar-act900 at a scan rate of 100 mv/s.