
Figure 1.
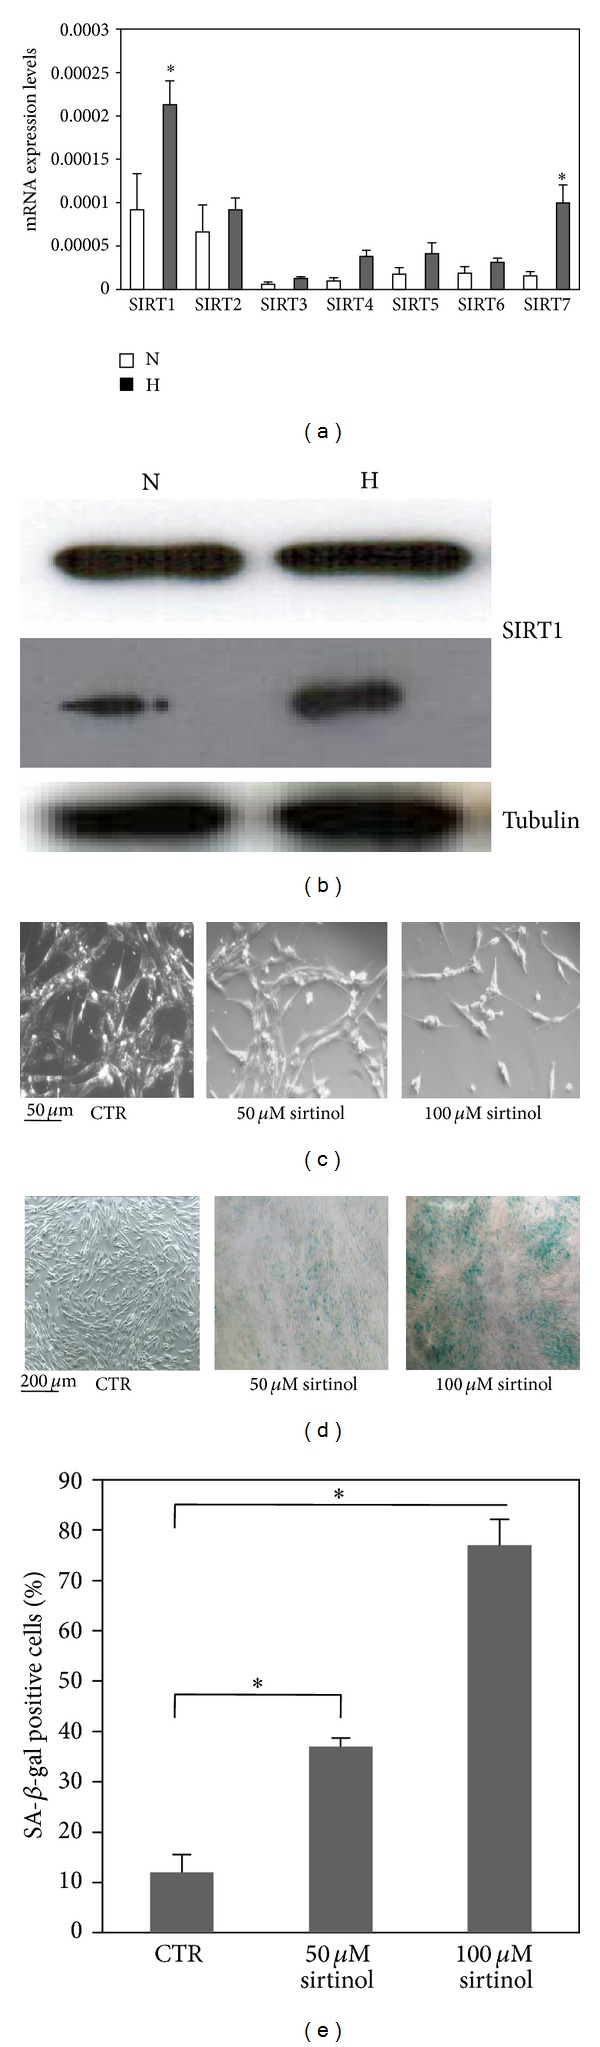
SIRT1–SIRT7 expression in hMSCs and effects of SIRT1 inhibition on phenotype. (a) SIRT1–SIRT7 mRNA levels were measured by real-time PCR (RT-PCR) analyses of total RNAs obtained from hMSCs exposed to either 21% O2 (N) or 1% O2 (H) for 24 h and relative expression (±SD) were shown. (b) Western blot analysis of hMSCs grown at either 21% O2 (N) or 1% O2 (H) for 24 h under normal conditions (upper panel) and serum-starved (lower panel). Antibodies against SIRT1 and tubulin were used. (c) Morphological changes in hMSCs were examined 8 days after treatment with sirtinol (50 and 100 μM) for 24 h (40x magnification, scale bars = 50 μm). (d) Representative photographs of blue-stained cells for SA-β-Gal activity are shown (10x magnification, scale bars = 200 μm) at 8 days after sirtinol (50 and 100 μM) treatment compared to control (CTR). (e) SA-β-Gal-positive cells were quantified by counting in at least 3 random fields for each condition. Results show the mean of three independent experiments. Graph represents means ± SD, n = 3. ∗ indicates statistical significance from control, P ≤ 0.05.