Figure 5.
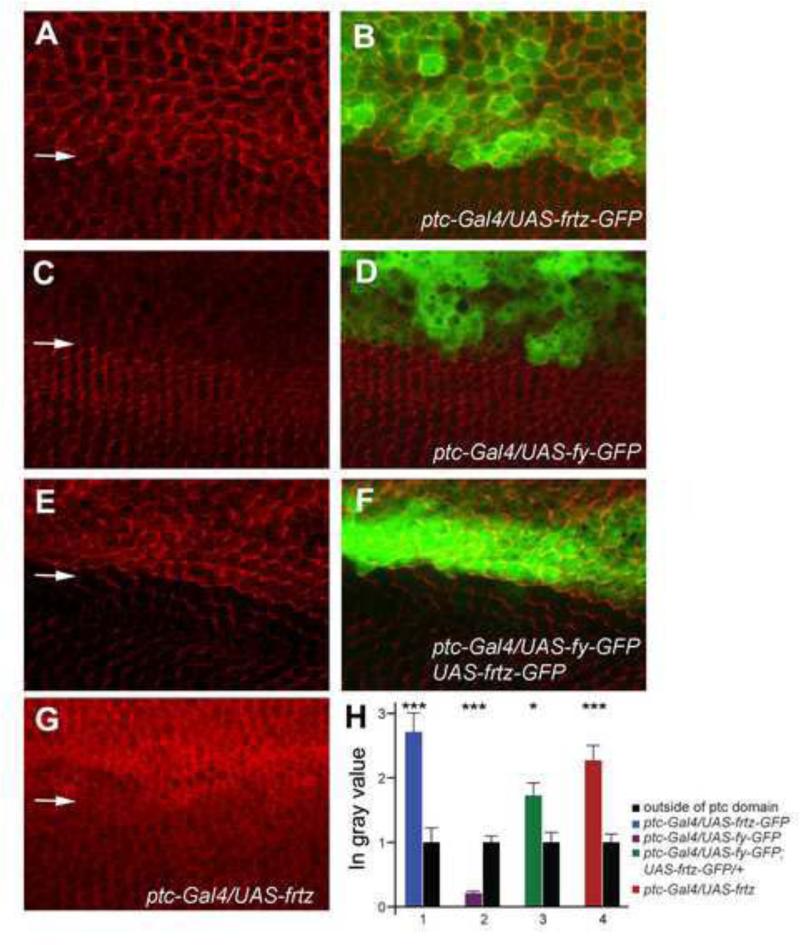
In accumulation is altered in wing cells by the over expression of frtz and fy. A and B show a ptc-Gal4/+; UAS-frtz-GFP/+ wing immunostained to show the endogenous In protein. The arrow marks the approximate location of the edge of the ptc-domain. Note the increased accumulation of In and its altered accumulation pattern associated with the over expression of frtz-GFP. C and D show a ptc-Gal4/+; UAS-fy-GFP/+ wing immunostained to show the endogenous In protein. The arrow marks the approximate location of the edge of the ptc-domain. Note the decreased accumulation of In associated with the over expression of fy-GFP. E and F show a ptc-Gal4/UAS-fy-GFP; UAS-frtz-GFP/+ wing immunostained to show the endogenous In protein. The arrow marks the approximate location of the edge of the ptc-domain. Note the increased accumulation of In and its altered accumulation pattern associated with the over expression of frtz-GFP. G shows a ptc-Gal4/ UAS-frtz wing immunostained to show the endogenous In protein. The arrow marks the approximate location of the edge of the ptc-domain. Note the increased accumulation of In where frtz was overexpressed. H shows the quantitation of the changes in In immunostaining inside and outside of the ptc domain. Average grey scale values in the ptc domain are normalized to the level outside of the ptc domain. A t-test was used to compare the grey values inside and outside of the ptc domain. * p = 0.05-0.01, ** p = 0.01-0.001, *** p<0.001.

