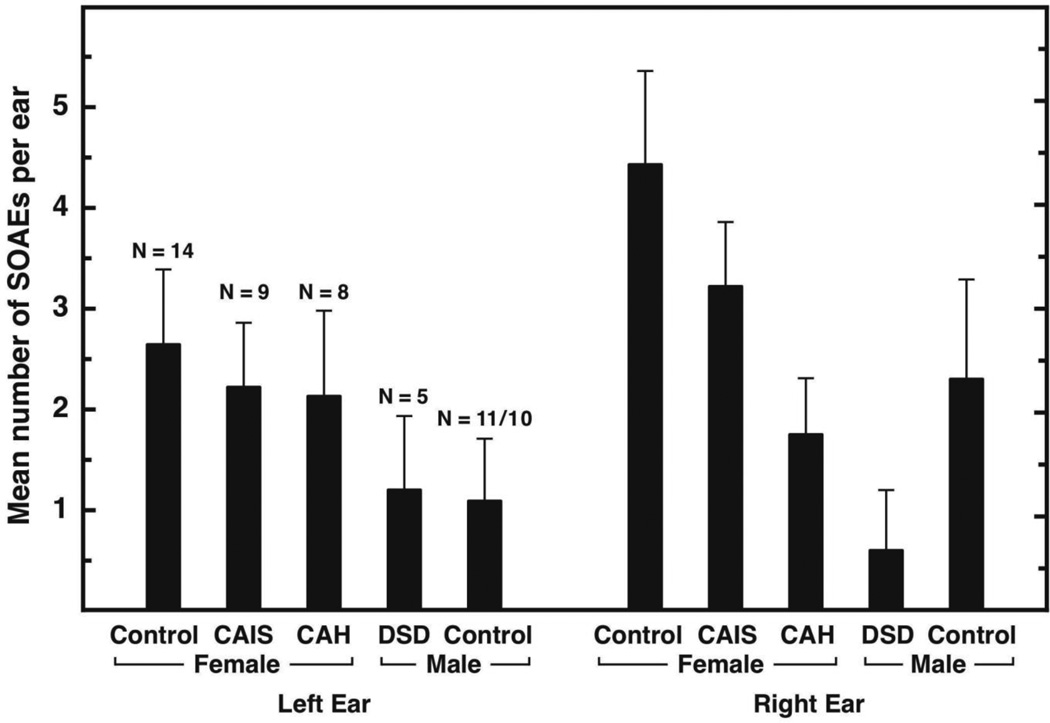
Figure 1.
Mean (+SEM) number of SOAEs detected in left and right ears, shown separately for the 5 participant groups. The frequency range 0.55 – 9.0 kHz was examined for SOAEs in each ear. The number of left and right ears contributing data is shown for each group; right-ear data for 1 control male were omitted because of hearing loss. The “Female” and “Male” designations on the abscissa indicate the gender with which participants identified.

