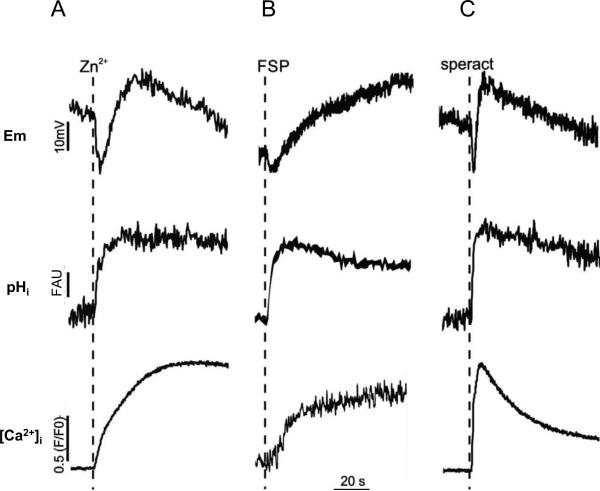
Fig. 1.
Zn2+ changes Em and increases pHi and [Ca2+]i as FSP and Speract.
Em (upper row records), pHi (middle row records) and [Ca2+]i (lower row records) of sea urchin sperm were measured in cell populations as described in methods. Dotted lines indicate a point of agonist addition: A, Zn2+ (10 M total); B, FSP (~100 nmol fucose/ml); C, 100 nM Speract. The free concentration of Zn2+ was estimated to be 0.2 nM in Em measurement (0.8 mM EDTA) and 1.8 nM in pHi and [Ca2+]i measurements (0.1 mM EDTA). Downward and upward deflections of each parameter indicate hyperpolarization and depolarization of Em and decreases and increases of [Ca2+]i and pHi, respectively. The scale of each parameter Em (mV), pHi (FAU, Fluorescence Arbitrary Units) and [Ca2+]i ((F/F0); where F is Fluo-4 (or Quin-2) fluorescence intensity and F0 is the fluorescence before adding speract or Zn2+) is indicated with vertical bars. The time scale was indicated by horizontal bars. Records shown in this figure are representative of at least three different animals. Zn2+ and FSP induced similar amounts of acrosome reaction that were ≥57%.

