
Figure 1.
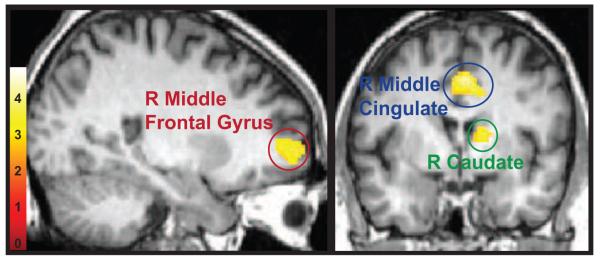
Whole-brain longitudinal results. Regions displaying a significant group difference for linear age changes during response inhibition displayed at a statistical threshold of p<0.005, 500 voxel extent. Three regions of interest passed the criteria of FDR cluster correction of p<0.05, 35 voxel extent: the right caudate (green), the right middle cingulate (blue), and the right middle frontal gyrus (red).