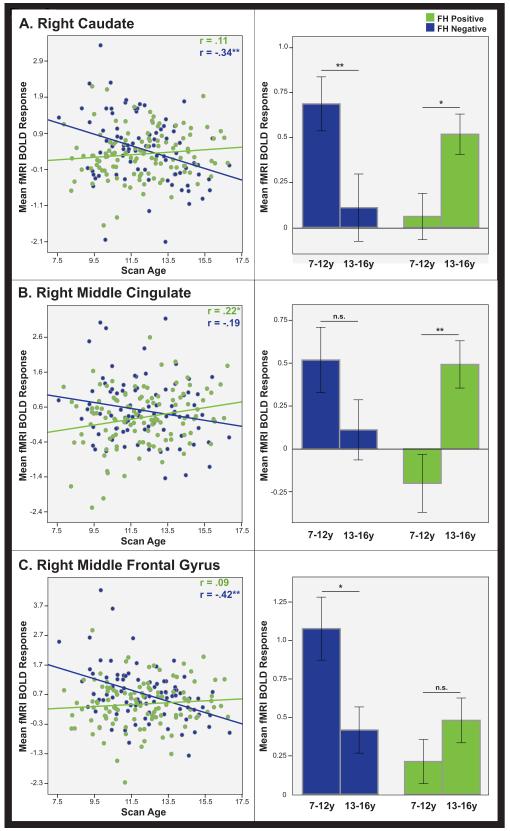
Figure 2.
Regions that showed a significant group difference in the whole-brain longitudinal analysis (outlined in Figure 1), plotted for FH+ (green) and FH− (blue) groups in the (A) right caudate, (B) right middle cingulate, and (C) right middle frontal gyrus. Longitudinal linear age effects are depicted in the scatterplots on the left, illustrating changes in mean fMRI activation response across time. Bar graphs on the right depict repeated measures ANOVA analysis between initial scans (ages 7-12.9) and a follow-up scan (ages 13-16.9) that confirm that the pattern of longitudinal effects are evident within subjects. Error bars represent ±1 standard error; ** indicates p<0.01; * indicates p<0.05; n.s.= non-significant.

