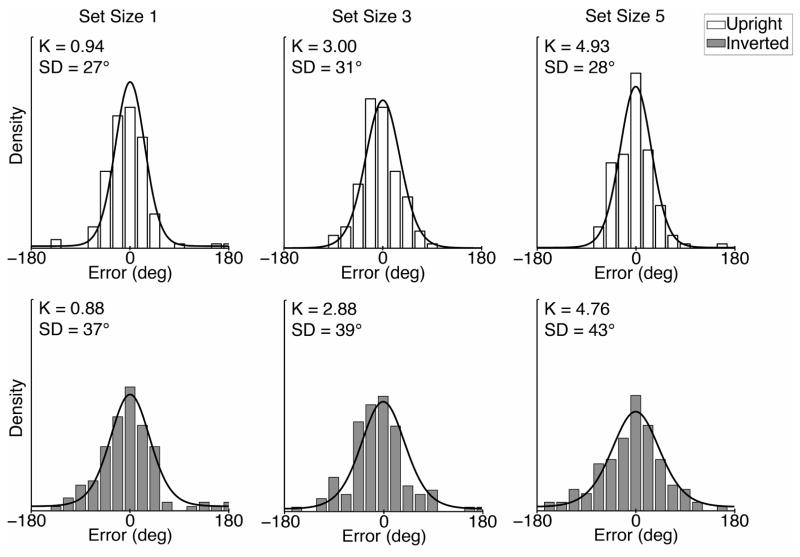
Figure 3.
Distribution of errors for faces reported from memory for a representative participant. Individual plots show the distribution of differences between the actual face and reported face for each set size and face orientation condition. The mixture model was fit to the data (lines denote predicted distributions), providing estimates of memory capacity (K) and precision (SD). The estimates of these parameters for this participant are shown for each condition.

