Figure 1:

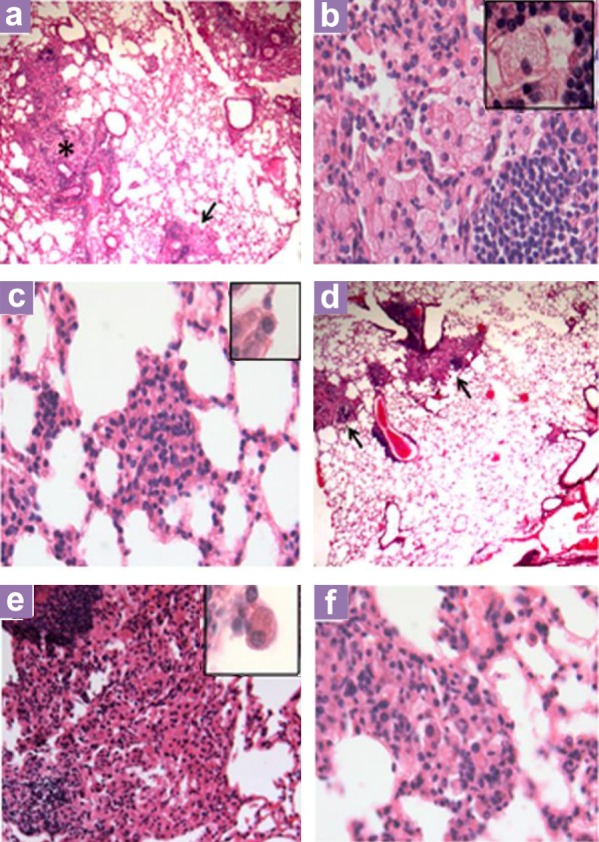
Representative histopathology of the lungs of mice treated with hsIgA in comparison with control nontreated tuberculous mice at day 60 of infection. (a) Low power micrograph shows extensive areas of pneumonia (asterisk) and focal necrosis (arrow) in the lung of a control mouse. (b) A high-power micrograph of these pneumonic areas reveals numerous vacuolated macrophages (inset). (c) A granuloma from the lung of a control mouse comprises small activated macrophages (inset). (d) In contrast, reduced pneumonic areas (arrow) are seen after 60 days of infection in mouse treated with hsIgA. (e) High power of this pneumonic area shows numerous activated macrophages with compact cytoplasms and large nuclei (inset). (f) Granuloma from the lung of mouse treated with hsIgA show numerous activated macrophages and abundant lymphocytes (low power micrograph 25× magnification, high power micrograph 200× magnification, inset 1000× magnification).
