
Table 2.
Upper extremity motor function before and after treatment
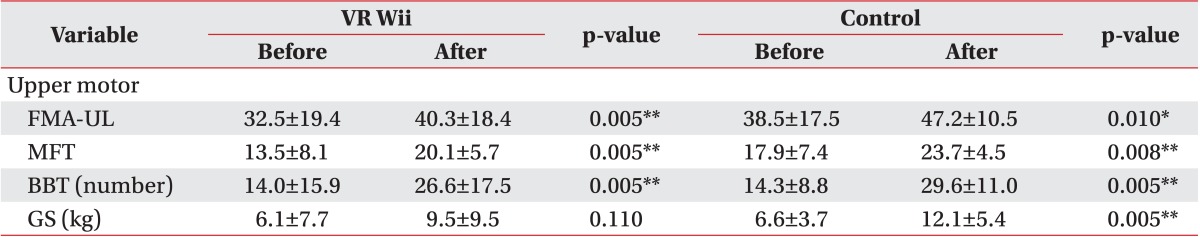
Values are presented as mean±standard deviation.
VR, virtual reality; FMA-UL, upper limb score in the Fugl-Meyer Assessment; MFT, manual function test; BBT, box and block test; GS, grip strength.
*p<0.05, **p<0.01.