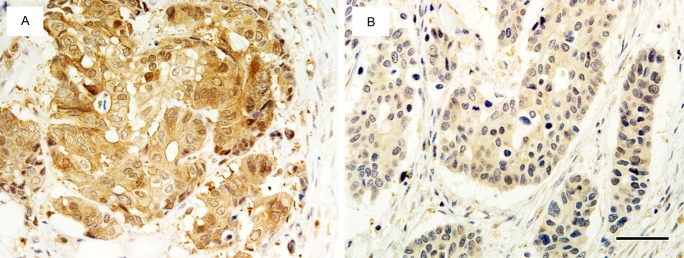
Figure 1.

Representative patterns of OAT2 immunostaining according to OTR. A. A tumor from a patient with mCRC who had a partial response (good OTR), showing OAT2High status. B. A tumor from a patient with mCRC who had a stable disease (poor OTR), showing OAT2Low status. Scale bar: 50 μm.
