
Figure 3.
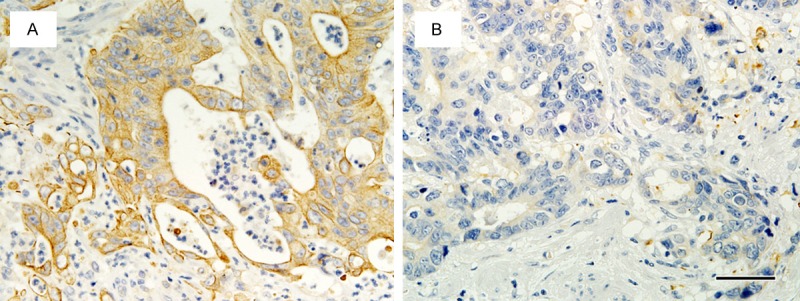
Representative patterns of OCT2 immunostaining according to PFS. A. A tumor from a patient with long PFS (24.0 months), showing OCT2High status. B. A tumor from a patient with short PFS (5.1 months), showing OCT2Low status. Scale bar: 50 μm.