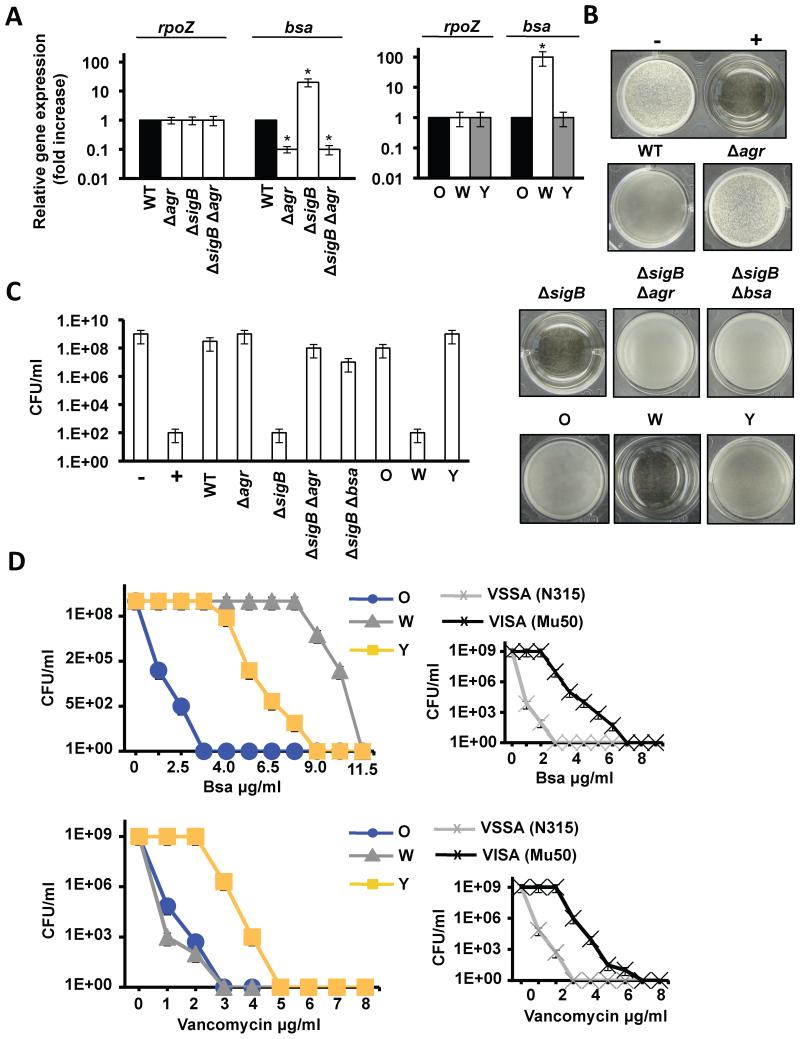
Figure 4. Adaptive abilities of the Y strain.
(A) qRT-PCR analysis of the expression of bsa in distinct genetic backgrounds (Student’s t-test p ≤ 0.05). (B) Antimicrobial activity of filter-sterilized supernatants. 50 μl was used to supplement 1 ml cultures of B. subtilis. Growth inhibition prevented biofilm growth. Negative and positive controls (− and +) represent B. subtilis cultures without and with kanamycin 5 μM. (C) Quantification microbial survival (CFU/ml) in B. subtilis cultures conditioned with Bsa. (D) Growth curves of O, W and Y in TSB medium with different concentrations of Bsa or vancomycin (CFU/ml). Right panels show control growth curves of isogenic VSSA/VISA strains (N315/Mu50) in the presence of different concentrations of Bsa or vancomycin. See fig. S5.

