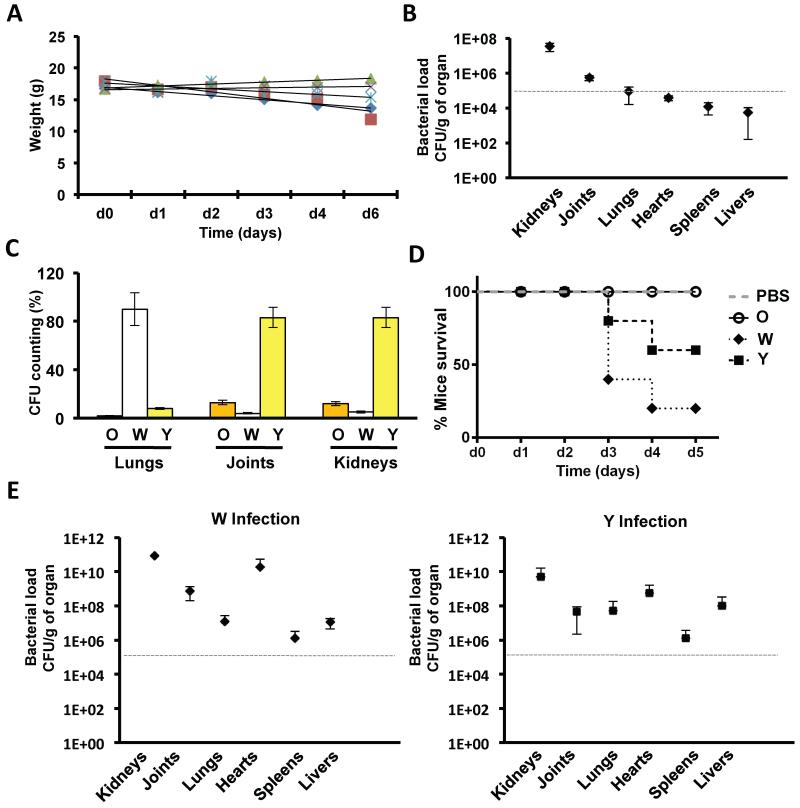
Figure 6. Diversification of S. aureus communities in vivo.
(A) Weight loss of infected BALB/c mice (n = 5) during the course of the infection. Mice were infected with 107 SC01 derivative previously grown in TSB medium (B) Bacterial loads in the different organs counted as CFU/g of organ. (C) Quantification of the colony forming units (CFU) of the distinct strains in the organs that showed higher bacterial load (≥ 105 CFU/g). (D) Survival curve of mice infected with O, W or Y strains. Cohorts of 5 mice were infected with 107 cells (in the case of O, W and Y infections) or PBS buffer as control. Mice were sacrificed when showing severe symptoms of infections (description of symptoms is in SI). (E) Quantification of CFU/g of W and Y strains in the organs of infected mice. A grey, dashed line defines a cut-off number of 105 CFU/g to define high and low bacterial load. See table S7.

