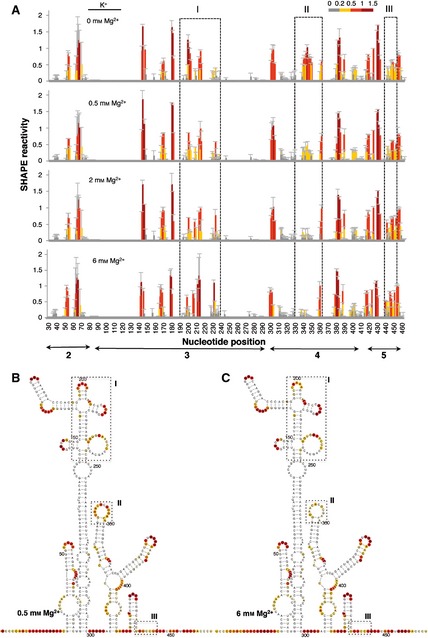
Figure 4.

RNA structure analysis of the IRES renatured in the presence of the monovalent ion K+. (A). SHAPE reactivity profiles of the IRES in the presence of 140 mm KCl at increasing concentrations of Mg2+ (0, 0.5, 2 and 6 mm). Values correspond to the mean SHAPE reactivity (±SD). The SHAPE reactivity is represented using the colored scale shown in Fig. 1C. Boxes I, II and III indicate the regions that show the main reactivity changes. (B, C) The RNA structure at 0.5 Mg2+ (B) and 6 mm Mg2+ (C). The symbols used are described in the legend to Fig. 2.
