
Figure 1.
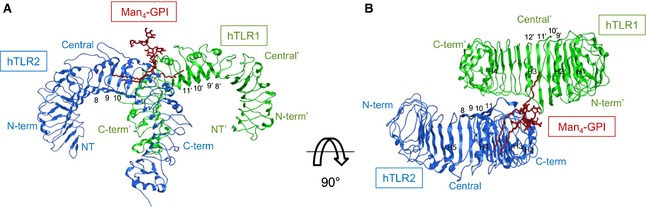
Docked structure of the hTLR2‐hTLR1–Man4‐GPI complex. Ribbon diagram of hTLR2‐hTLR1–Man4‐GPI (hTLR2, hTLR1 and Man4‐GPI are shown in green, blue and dark red, respectively). (A) Side view. (B) Top view. LRR modules and helix numbers are written in black.