
Figure 7.
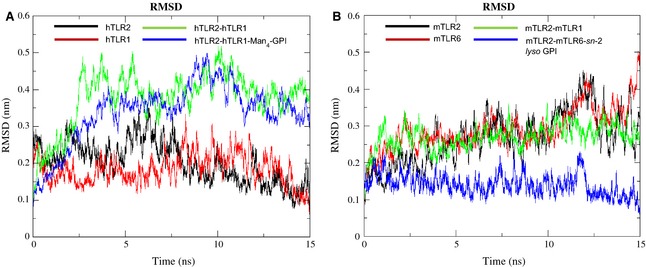
RMSD plots of ligand‐bound and ligand‐unbound complexes. (A) The RMSD plot for the backbone atoms of hTLR2, hTLR1, hTLR2‐ hTLR1 and hTLR2‐hTLR1‐Man4‐GPI relative to the initial structure over 15‐ns MD simulations. (B) The RMSD plot for the backbone atoms of mTLR2, mTLR6, mTLR2‐mTLR6 and mTLR2‐mTLR6‐sn‐2 lyso GPI relative to the initial structure over 15‐ns MD simulations.