
Figure 8.
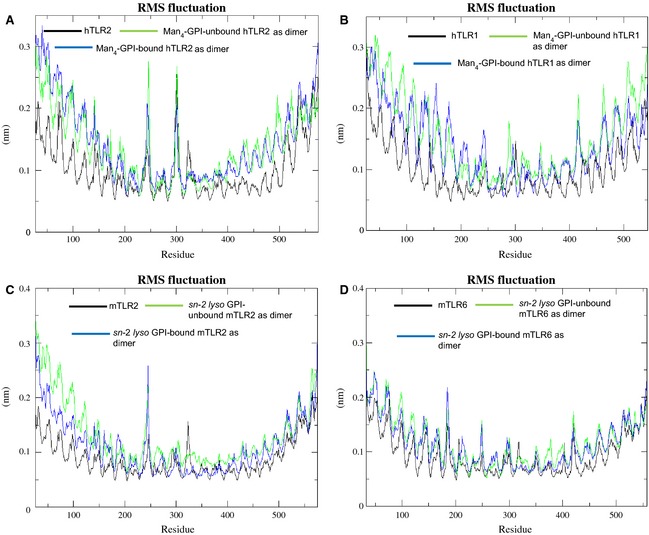
RMSF Plots of ligand‐bound and ligand‐unbound complexes. RMSF plots of residue fluctuations obtained by averaging atomic fluctuations over the last 5 ns of MD simulations. Ligand‐bound and ligand‐unbound states of (A) hTLR2, (B) hTLR1, (C) mTLR2 and (D) mTLR6.