
Figure 9.
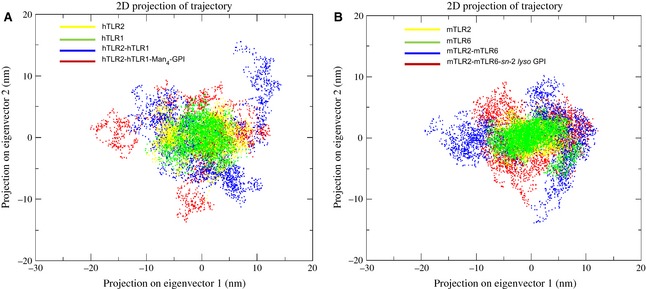
PCA of the TLR2 subfamily. The cloud represents the 15‐ns trajectories projected onto the first two eigenvectors. Every fifth frame of the respective trajectories has been used in both projections. The x‐axis and y‐axis show the projection of the structures of the backbone atoms in the MD trajectories onto the essential space (planes) defined by eigenvectors 1 and 2. (A) The clouds coloured in yellow, green, blue and red display the monomer of hTLR2, hTLR1, hTLR2‐hTLR1 and hTLR2‐hTLR1‐Man4‐GPI trajectories, respectively. (B) The clouds coloured in yellow, green, blue and red display the mTLR2, mTLR6, mTLR2‐mTLR6 and mTLR2‐mTLR6‐ sn‐2 lyso GPI trajectories, respectively.