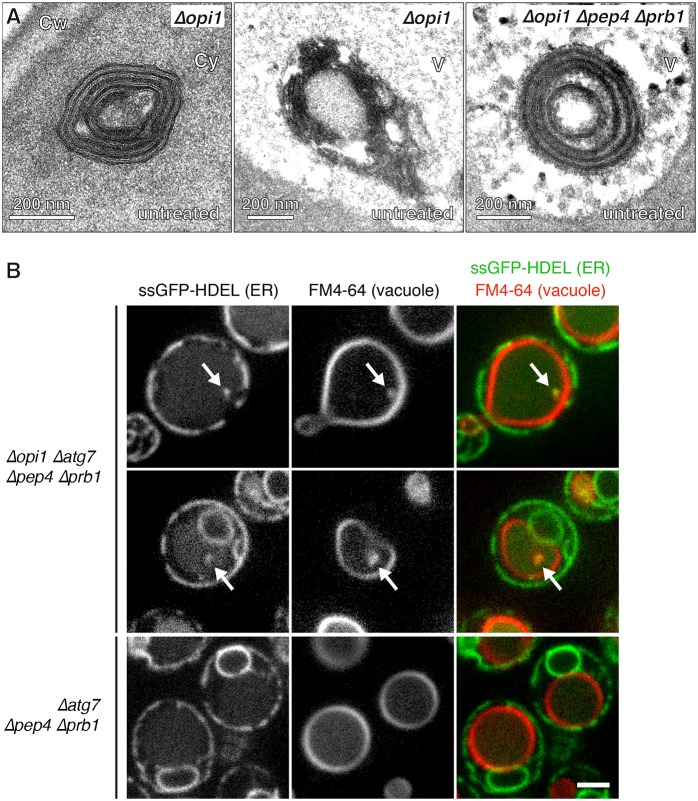
Fig. 7.
Degradation of excess ER by selective autophagy. (A) Electron micrographs of untreated Δopi1 and Δopi1 Δpep4 Δprb1 cells. Cw, cell wall; Cy, cytoplasm; V, vacuole. (B) Confocal images of Δopi1 Δatg7 Δpep4 Δprb1 and Δatg7 Δpep4 Δprb1 cells expressing the ER marker ssGFP-HDEL. Cells were stained with the vacuolar membrane dye FM4-64 but otherwise untreated. Arrows point to ER inside the vacuole where it colocalizes with vacuolar membrane. Scale bar: 2 µm.

