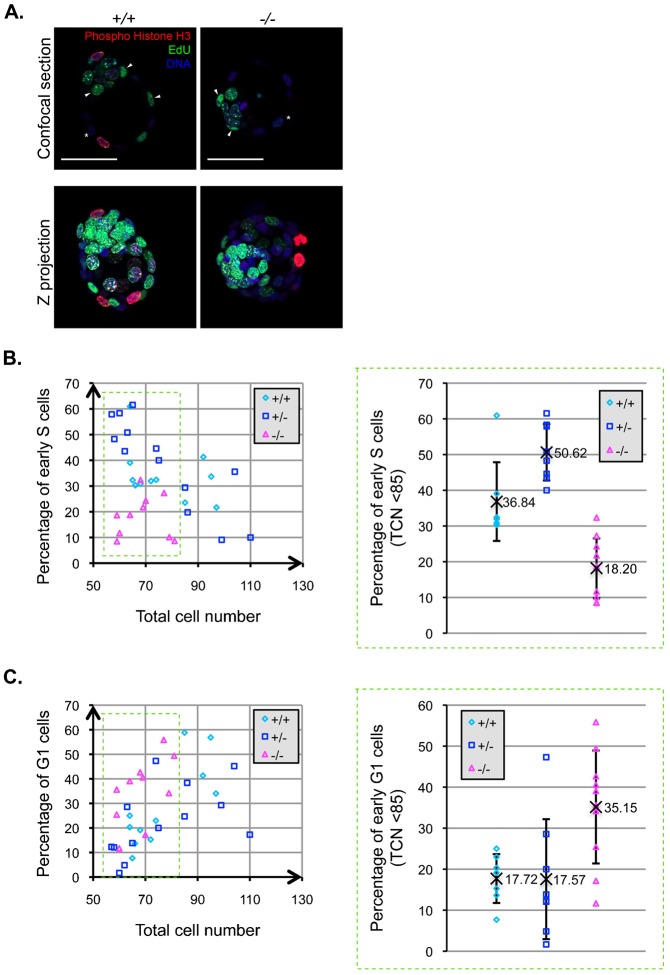
Fig. 4. PDCD2 knockout in the embryo results in defects in S phase entry.
(A) Confocal images showing EdU incorporation (green), immunofluorescence for Phospho-Histone H3 (red) and Hoechst labelling (blue). Arrowheads indicate a subset of early S phase cells (diffuse EdU positive, Phospho-Histone H3 negative) and asterisks indicate examples of G1 phase cells (EdU negative, Phospho-Histone H3 negative). (B) Left panel represents the percentage of cells in early S phase (diffuse EdU positive, Phospho-Histone H3 negative) relative to the total cell number (TCN-Hoechst positive cells). Right panel represents the percentage of early S phase among embryos that have a TCN of less than 85 (derived from data in the green dashed box of left panel). Homozygous knockout embryos contain significantly fewer S phase cells (average 18%, N = 10) than WT (average 37%, N = 7, p = 0.001 by t test) and heterozygous (average 51%, N = 8, p = 0.0004 by t test). (C) Left panel represents the percentage of cells in early G1 phase (EdU negative, Phospho-Histone H3 negative) relative to the total cells number (TCN-Hoechst positive cells). Right panel represents the percentage of early G1 phase among embryos that have a TCN of less than 85. Homozygous knockout embryos contain significantly fewer S phase cells (average 35%, N = 10) than WT (average 18%, N = 7, p = 0.006 by t test) and heterozygous (average 18%, N = 8, p = 0.01 by t test). Scale bars: 50 µm.

