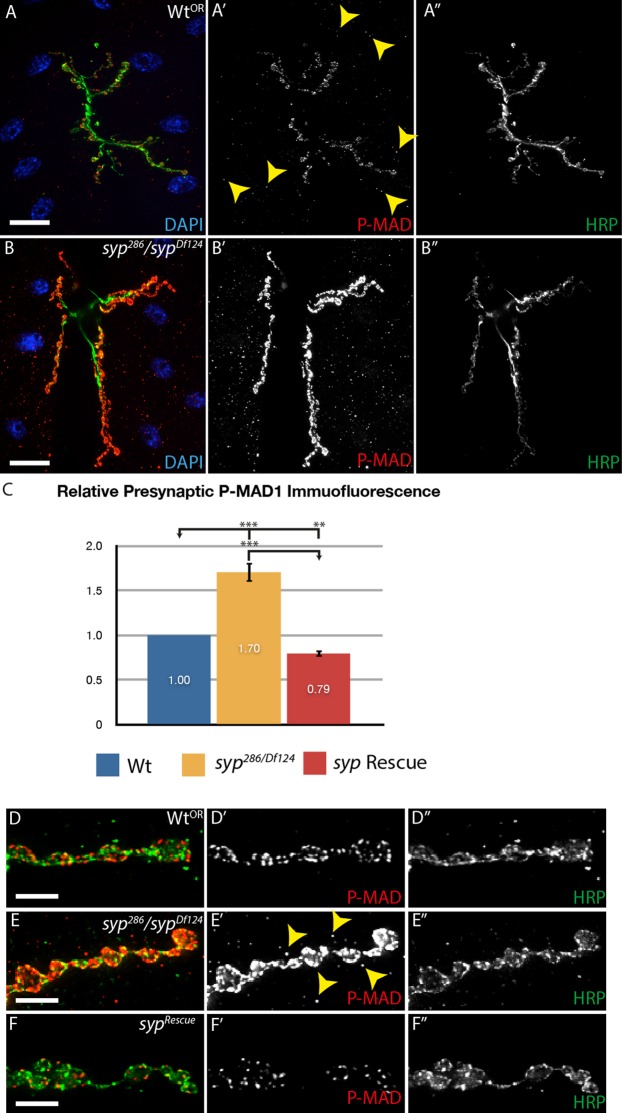
Fig. 5. syncrip mutants exhibit elevated P-MAD levels in both muscle and neuron.
(A,B) Merged image showing DAPI stained muscle nuclei (blue), motoneurons bouton stained with HRP (green) and P-MAD signal (red). P-MAD was elevated in both the presynaptic and postsynaptic compartment of syncrip mutants relative to controls. (A′,B′) Single channel showing P-MAD staining. (A″,B″) Single channel showing HRP staining. (A–A″) wild type. (B–B″) syp mutant (syp286/Df124). Yellow arrowheads in A′ indicate low levels of postsynaptic P-MAD in wild type controls. (C) Bespoke imaging quantification tools reveal that syp mutants exhibit a ∼1.7-fold increase in the presynaptic levels of phosphorylated MAD relative to wildtype, indicating upregulated retrograde signaling. Quantification of the P-MAD immunofluorescence was performed on full z-stacks. Independent two-tailed Student's t-test; *** p<0.001, ** p<0.005 (* p<0.05, n.s. p>0.05). (D–F) Merged high magnification maximum intensity projections of 5 µm thickness showing HRP (green) and P-MAD (red). (D–D″) wild type. (E–E″) syp mutant (syp286/Df124). (F–F″) rescued syp mutant. (D′–F′) Single channel showing P-MAD staining. (D″–F″) Single channel showing HRP. Scale bars: (A–B″) 40 µm, (D–F″) 5 µm.

