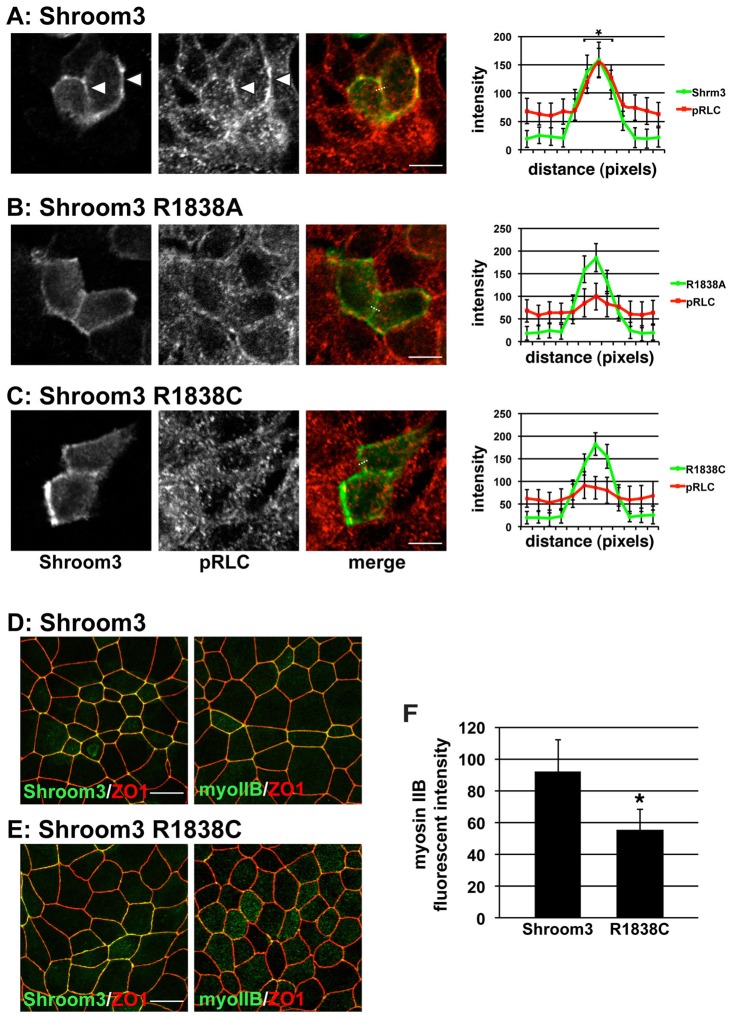
Fig. 5. Shroom3 R1838 substitution mutations do not activate myosin II.
(A–C) MDCK cells were transiently transfected with expression vectors for hRock1 and either Shroom3 (A), Shroom3 R1838A (B), or Shroom3 R1838C (C) and stained to detect Shroom3 (green) and phosphorylated RLC (pRLC, red). Right-hand panels show quantification of fluorescent intensity of Shroom3 (green) and pRLC (red) at the adherens junctions (arrowheads), as defined by Shroom3 staining. Dotted line denotes representative ROI used to measure fluorescent intensity; scale bar, 10 µm; * denotes significant differences (p<0.01 using an unpaired t-test) in pRLC fluorescence intensity in cells expressing wildtype Shroom3 relative to cells expressing either the R1838A or R1838C variant, n≧30 cells. (D,E) MDCK cells selected for expression of either Shroom3 or Shroom3 R1838C were stained to detect Shroom3 and ZO1 or myosin IIb and ZO1. Scale bar, 10 µm. (F) Quantification of myosin IIb localization in cells expressing Shroom3 or Shroom3 R1838C. Error bars indicate ± s.d., * indicates p<0.01 relative to Shroom3-expressing cells using an unpaired t-test, n≧30 cells in 3 experiments.

