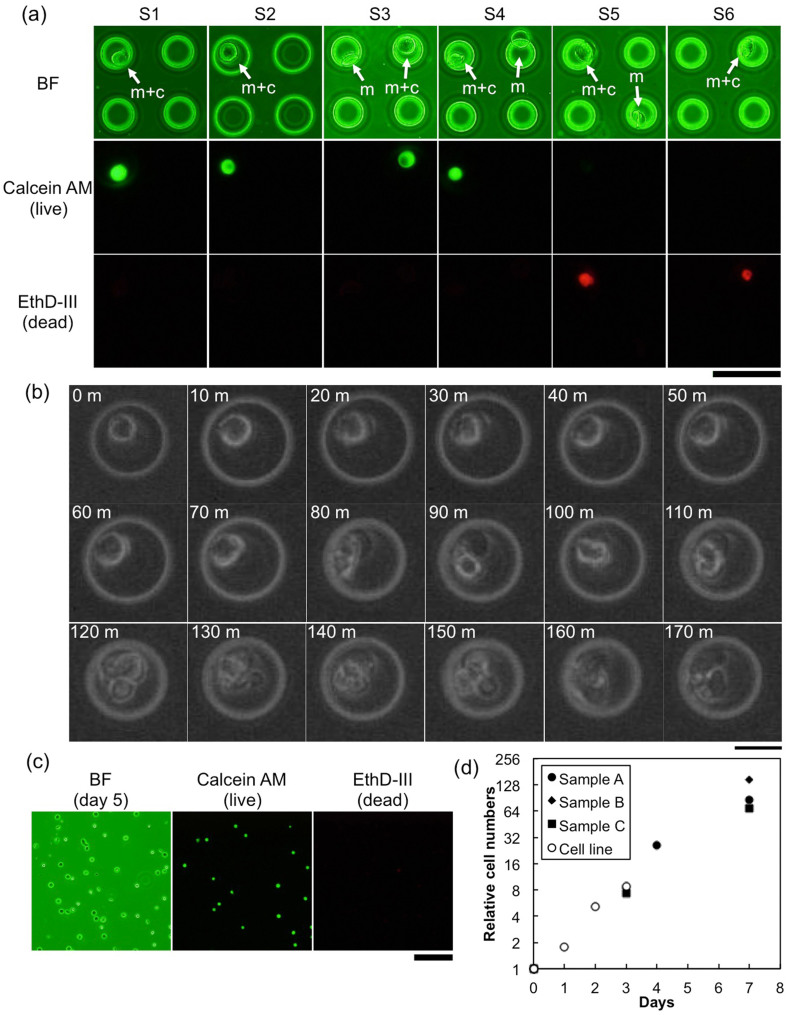
Figure 4. Evaluation of collected cell survival.
(a) Optical and fluorescent microscope images of two-color fluorescent staining results for six typical samples (S1–S6). Cells captured by the magcups (m + c) and empty magcups (m) are indicated by arrows in bright field (BF) images. Bar, 50 μm. (b) Time-lapse observation of a collected cell. The cell still in the magcup was placed into a small PDMS chamber (shown as an outer white circle in the pictures) to prevent diffusion, and pictures were taken every 10 min. The time elapsed since the start of monitoring is shown in each picture. Bar, 20 μm. (c) Optical and fluorescent microscope images of two-color fluorescent staining results for collected cells using magcups after 5 days of incubation in culture medium. Bar, 100 μm. (d) Relationships between relative cell numbers and the periods elapsed since the start of cultivation for three independent cell collection assays by the magcup (black circle, diamond, and square). Results for a cultivated CCRF-CEM cell line are also plotted (white circle).

