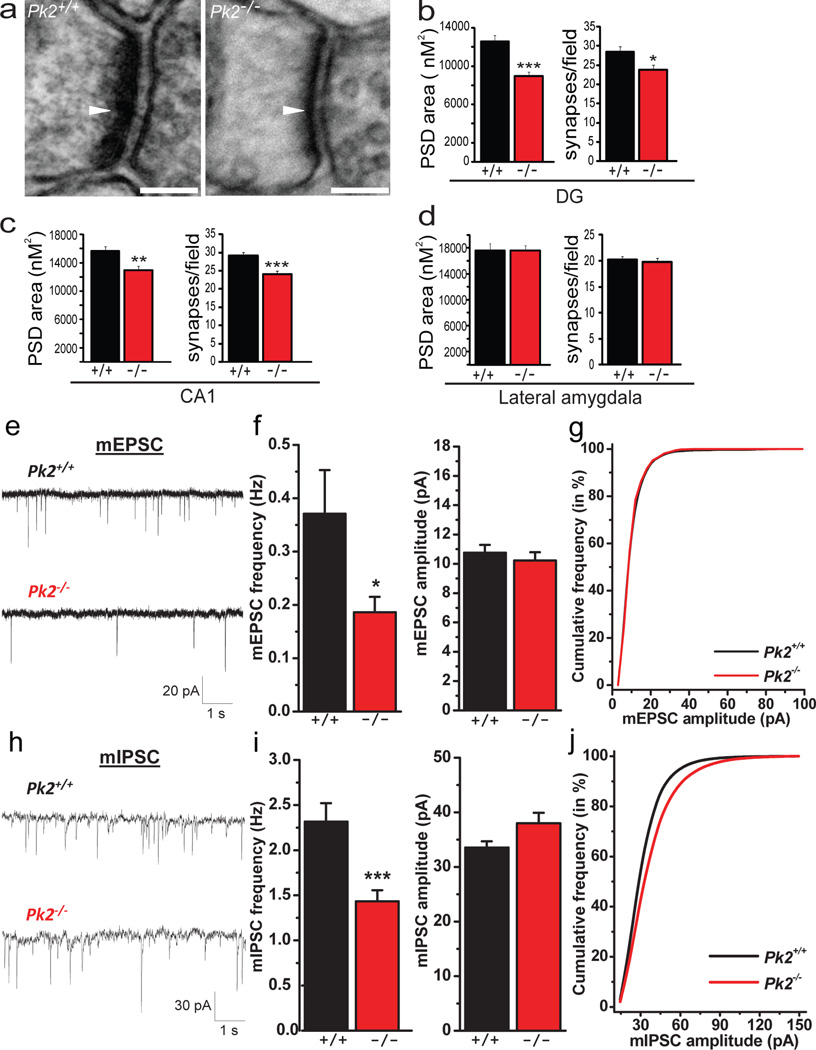
Figure 3. Prickle2−/− hippocampal neurons display altered hippocampal synapse morphology and decreased basal synaptic transmission.
(a–d) TEM analysis of Pk2+/+ (+/+) and Pk2−/− (−/−) post synaptic densities (PSD) (a). Dentate gyrus PSD size (***p=0.0001) and synapses/field (*p=0.017) are significantly reduced in Pk2−/− mice (b). CA1 PSD area (**p=0.001) and synaptic number (***p=0.0006) are significantly decreased in Pk2−/− mice (c). Lateral amygdala PSD size (p=0.98) and synaptic number (p=0.81) are normal in Pk2−/− mice (d); See methods for all n values, scale bar = 100nM. (e–g) mEPSC recordings from CA1 pyramidal neurons in acute hippocampal slices. Representative mEPSC traces from Pk2+/+ and Pk2−/− slices (e). mEPSC frequency (*p=0.03) but not amplitude (p>0.05) is reduced in Pk2−/− mice (f). (Pk2+/+, n=18 neurons; Pk2−/−, n=14 neurons) from at least 5 slices. Cumulative probability plot confirms the decrease in frequency with no change in amplitude (g). (h–j) mIPSC recordings from CA1 pyramidal neurons in acute hippocampal slices. Representative mIPSC traces from Pk2+/+ and Pk2−/− slices (h). Pk2−/− neurons show a significant decrease in mIPSC frequency (***p=0.0007), and no difference in mIPSC amplitude (p>0.05) (i). (Pk2+/+, n=21; Pk2−/−, n=26). Cumulative probability plot for mIPSCs confirms the decrease in frequency with no change in amplitude (j). Mann-Whitney U test was performed for all comparisons. Error bars represent ± S.E.M.

