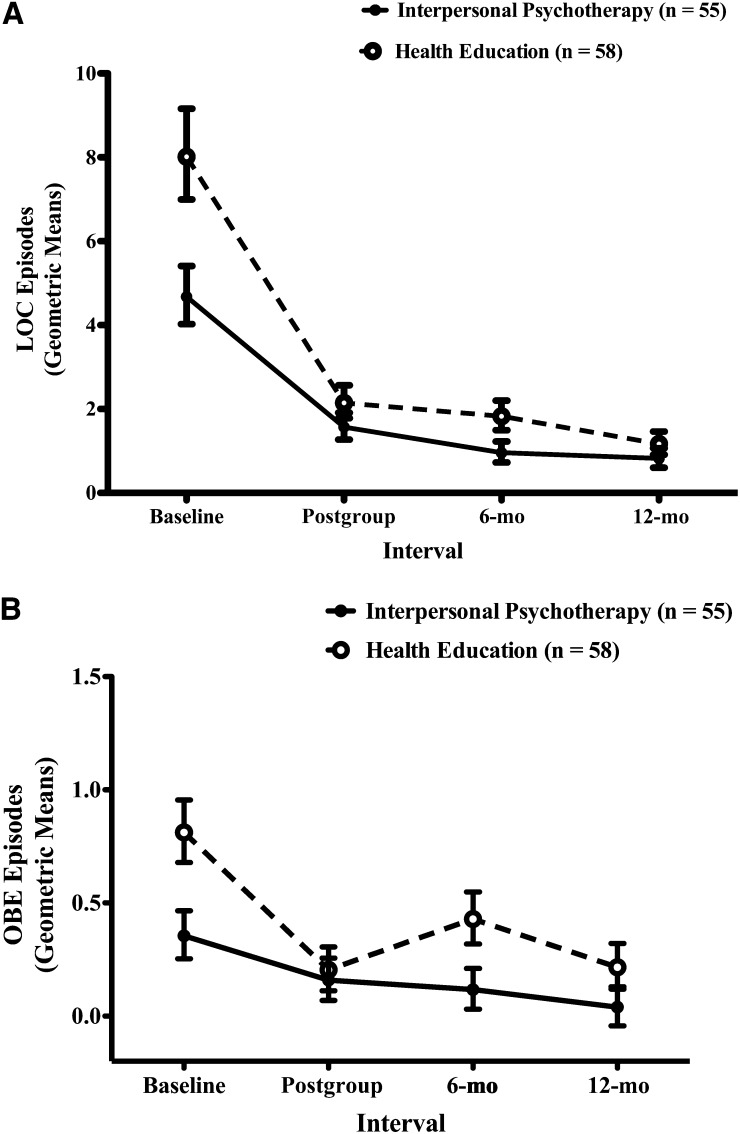
FIGURE 3.
Linear mixed models with repeated measures with the use of maximum-likelihood estimation were used to examine mean (±SE) changes in LOC-eating episodes in the past 3 mo (P-group = 0.03, P-interval < 0.001, P-group × interval = 0.35) (A) and classic OBE episodes in the past 3 mo (P-group = 0.02, P-interval < 0.001, P-group × interval = 0.26) (B) over the course of the study by group assignment. Geometric means of disordered eating episodes are displayed. LOC, loss of control; OBE, objective binge eating.

