
Figure 3.
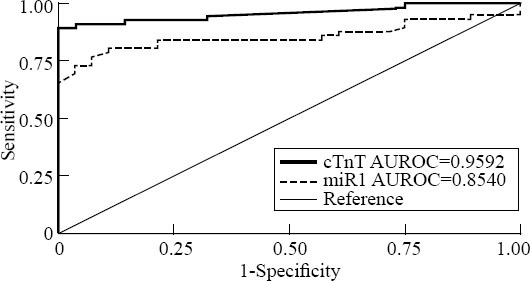
Comparisons of the sensitivity and specificity of the diagnosis by plasma miRNA-1 and cTnT in the AMI patients. ROC curves were constructed to evaluate the diagnostic values of miR-1 for the AMI patients in comparison with cTnT. AUC: area under the ROC curve.