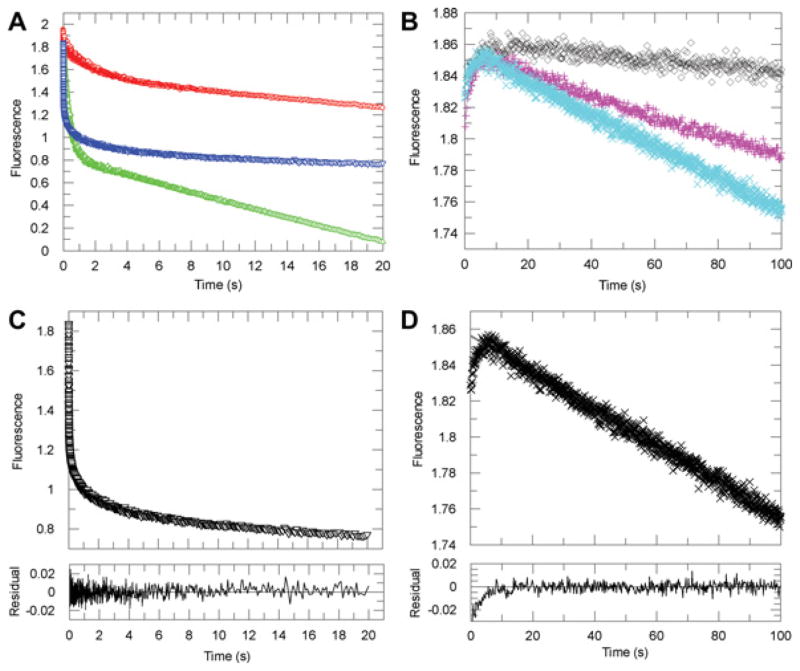
Figure 3. Representative kinetic traces for the multiple-turnover reactions catalysed by AKR1D1 in the transient state.
(A) Averaged progress curves of decreases in NADPH fluorescence for samples containing testosterone (red), cortisone (blue) and aldosterone (green). (B) Averaged progress curves of decreases in NADPH fluorescence for samples containing no steroid (black), cholestenone (magenta) or 7α-hydroxycholestenone (cyan). (C) Fitting of an averaged trace of cortisone multiple-turnover reaction to the burst equation. (D) Fitting of an averaged trace of 7α-hydroxycholestenone multiple-turnover reaction to the linear equation. The initial increase in fluorescence signal in the reaction of 7α-hydroxycholestenone was also observed in the sample containing no steroid and was not used in data fitting. Fitted lines are in grey and are mostly superimposed by the actual data points. Residual plots demonstrate the quality of the fit.

