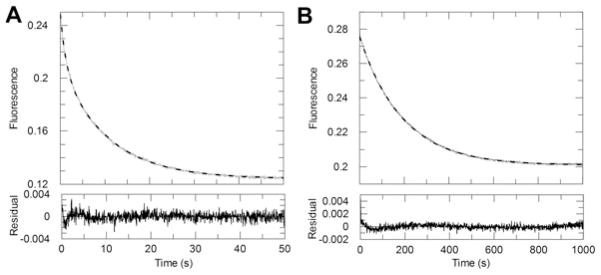
Figure 4. Representative kinetic traces for the single-turnover reactions catalysed by AKR1D1.

(A) The averaged progress curves for the reaction of the pre-mixed enzyme–NADPH solution with cortisone. Data were fitted to a double-exponential function. (B) The averaged progress curves for the reaction of the pre-mixed enzyme–NADPH solution with 7α-hydroxycholestenone. Data were fitted to a single-exponential function. Fitted lines are shown in grey. Residual plots demonstrate the quality of the fit. Note the different time window used for the two substrates.
